In the world of Wi-Fi, CPEs generate vast amounts of time series data—metrics like Wi-Fi band usage, device uptimes, and hardware statistics are recorded continuously. Occasionally, something unusual happens: a sudden increase in memory issues after a new CPE rollout, a widespread drop in received data following an outage, or a spike in reboots during a firmware upgrade. These are anomalies, and detecting them quickly is critical for preventing service degradation, customer dissatisfaction, or operational blind spots.
We developed an AI-driven anomaly detection tool to assist our experts in monitoring the vast amount of time series data collected by Lifemote. By automatically surfacing irregular patterns across millions of data points, the tool helps our Customer Success, Research, and Data Collection teams focus their attention where it’s needed most—alerting the right specialists as soon as anomalies appear, so investigations can begin without delay.
So, what is an anomaly, what types of anomalies are we looking for, what have we detected so far, and how did we do it? Let’s break it down in simple terms.
What Is a Time-Series Anomaly?
An anomaly is an observation that stands out because it doesn’t follow the expected pattern and appears to be generated by a different mechanism. Anomalies are very rare and differ significantly from the rest of the normal observations.
Time series anomaly detection refers to the process of identifying unusual patterns within sequential data points collected over time.
Types of Anomalies
Not all anomalies are created equal. Some are harder to detect, others are more urgent to address. We classify anomalies into three categories:
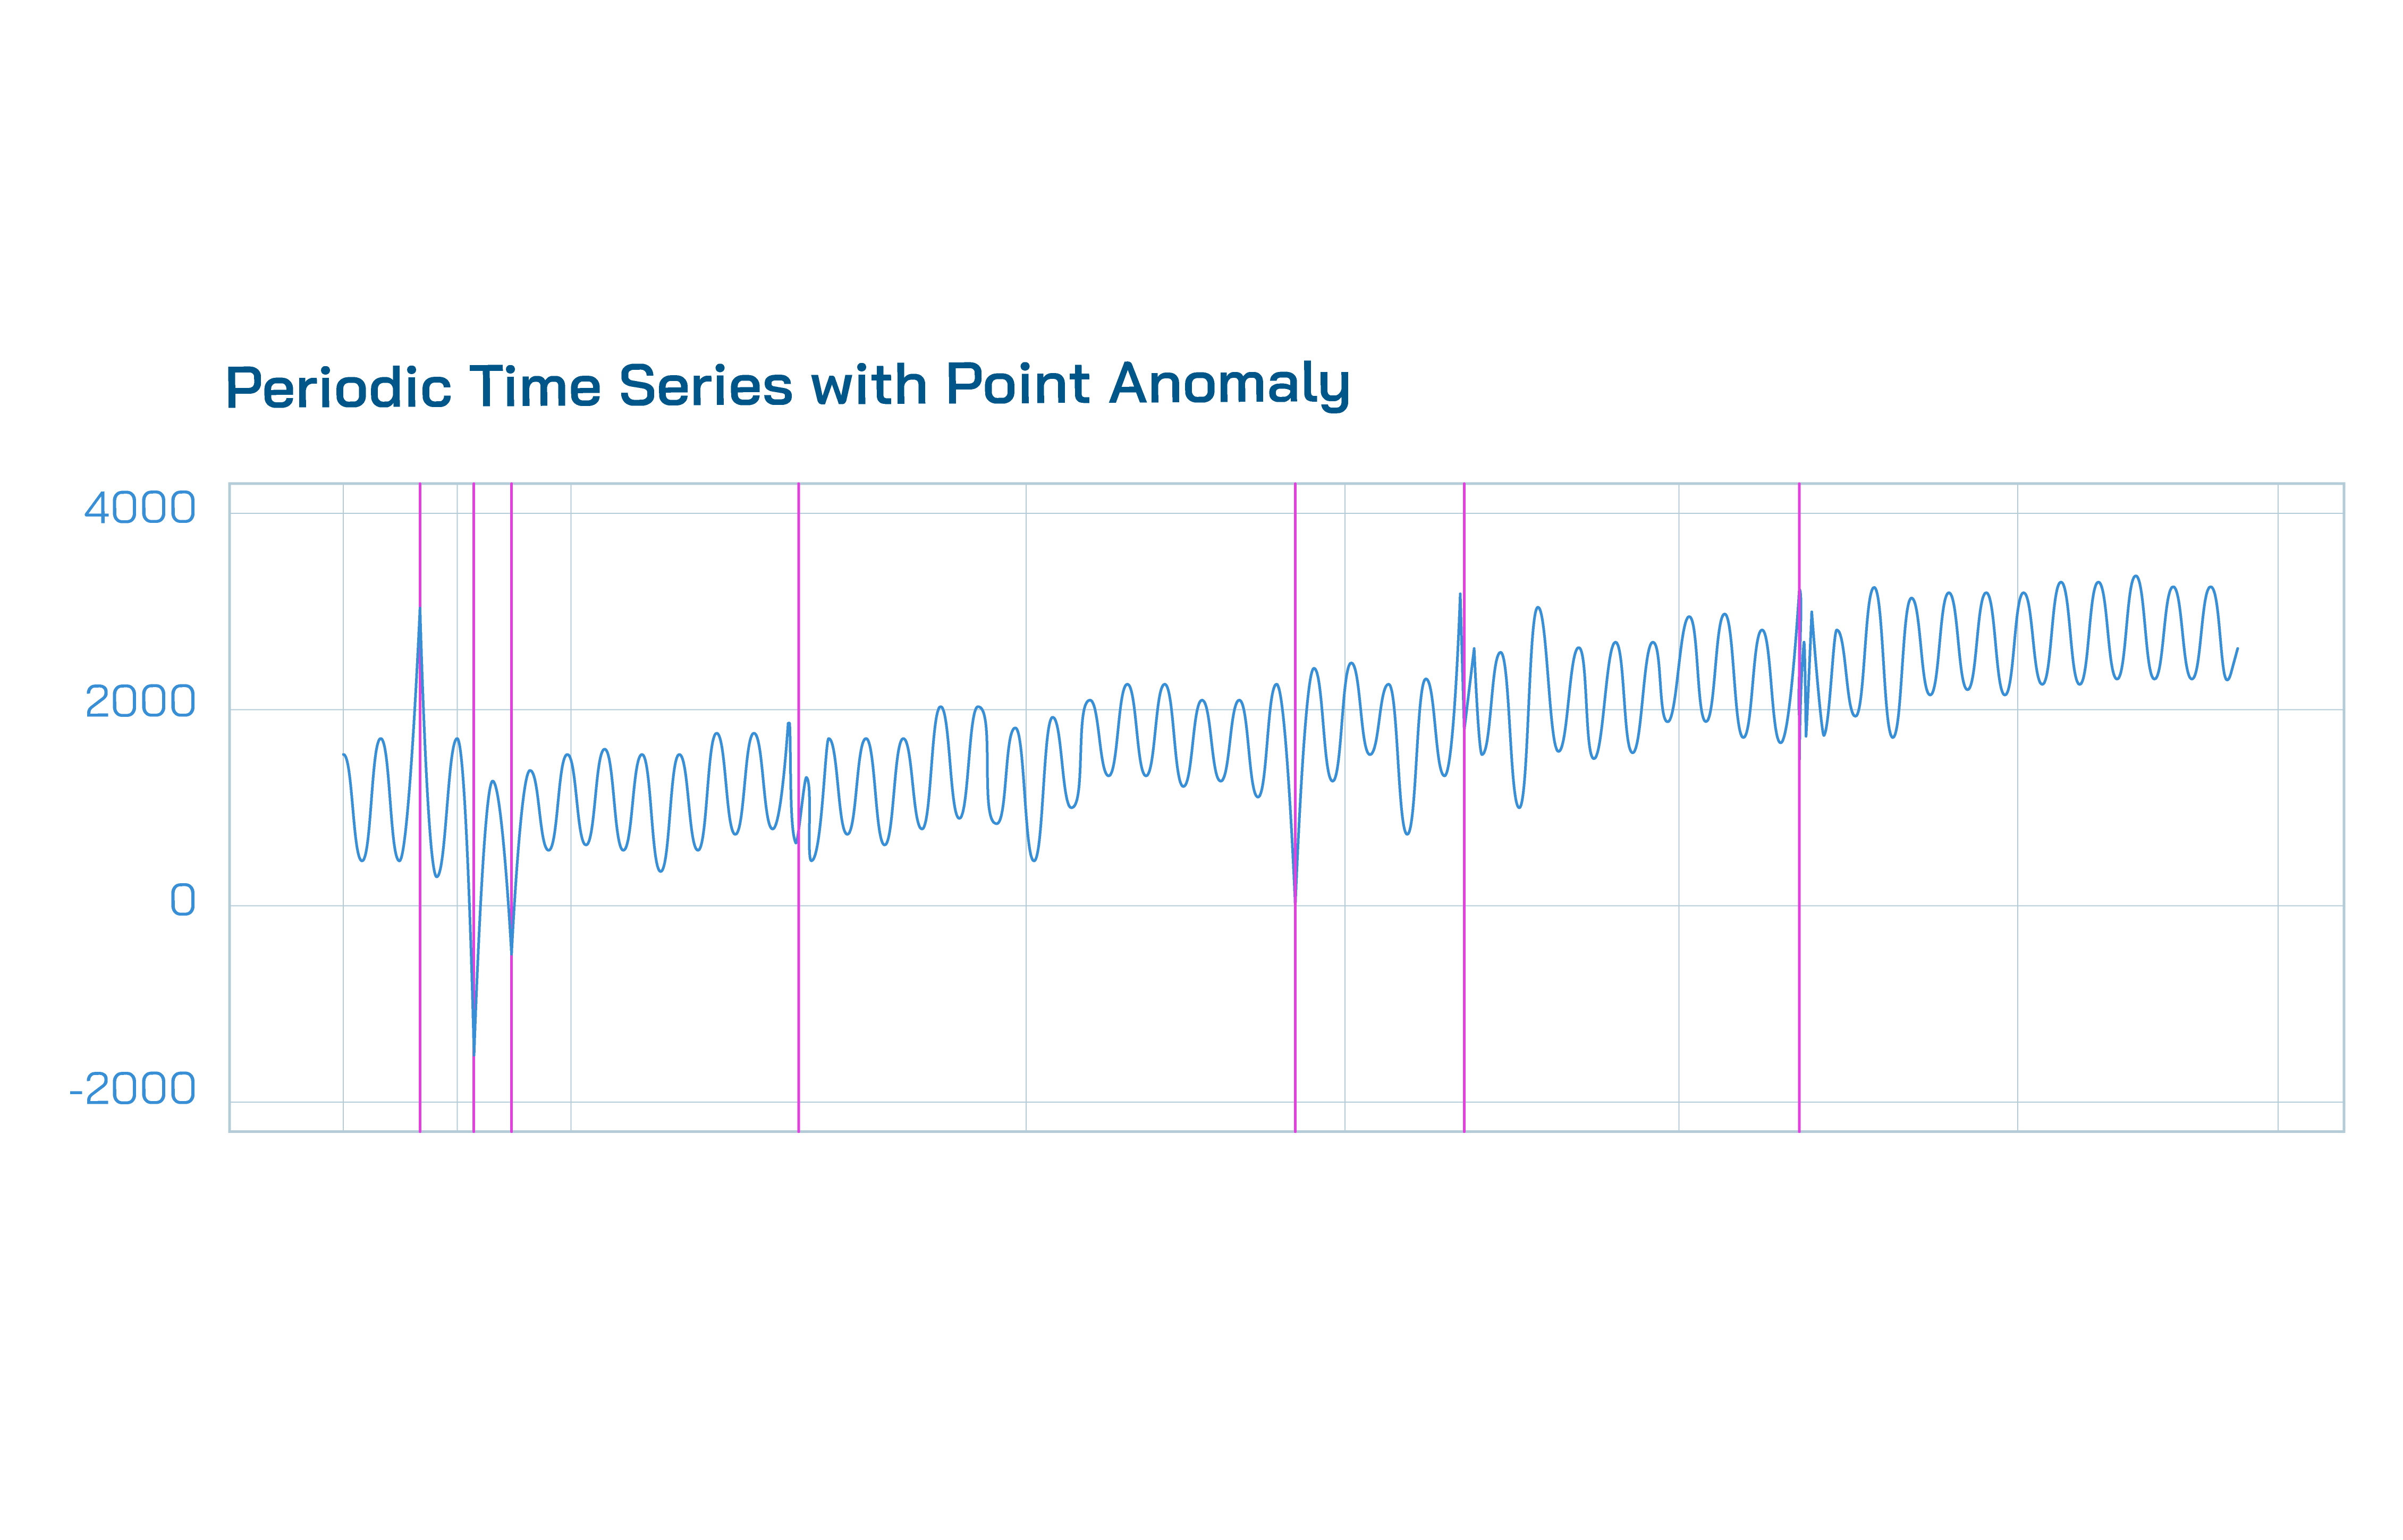
- Point Anomalies are singular data points that suddenly deviate from the normal range of the series, either globally or locally. For example, we tend to observe point anomalies in our outage event counter in the form of increased spikes. Upon detecting such anomalies, we promptly notify our customers to provide additional visibility on the impact of the outage.
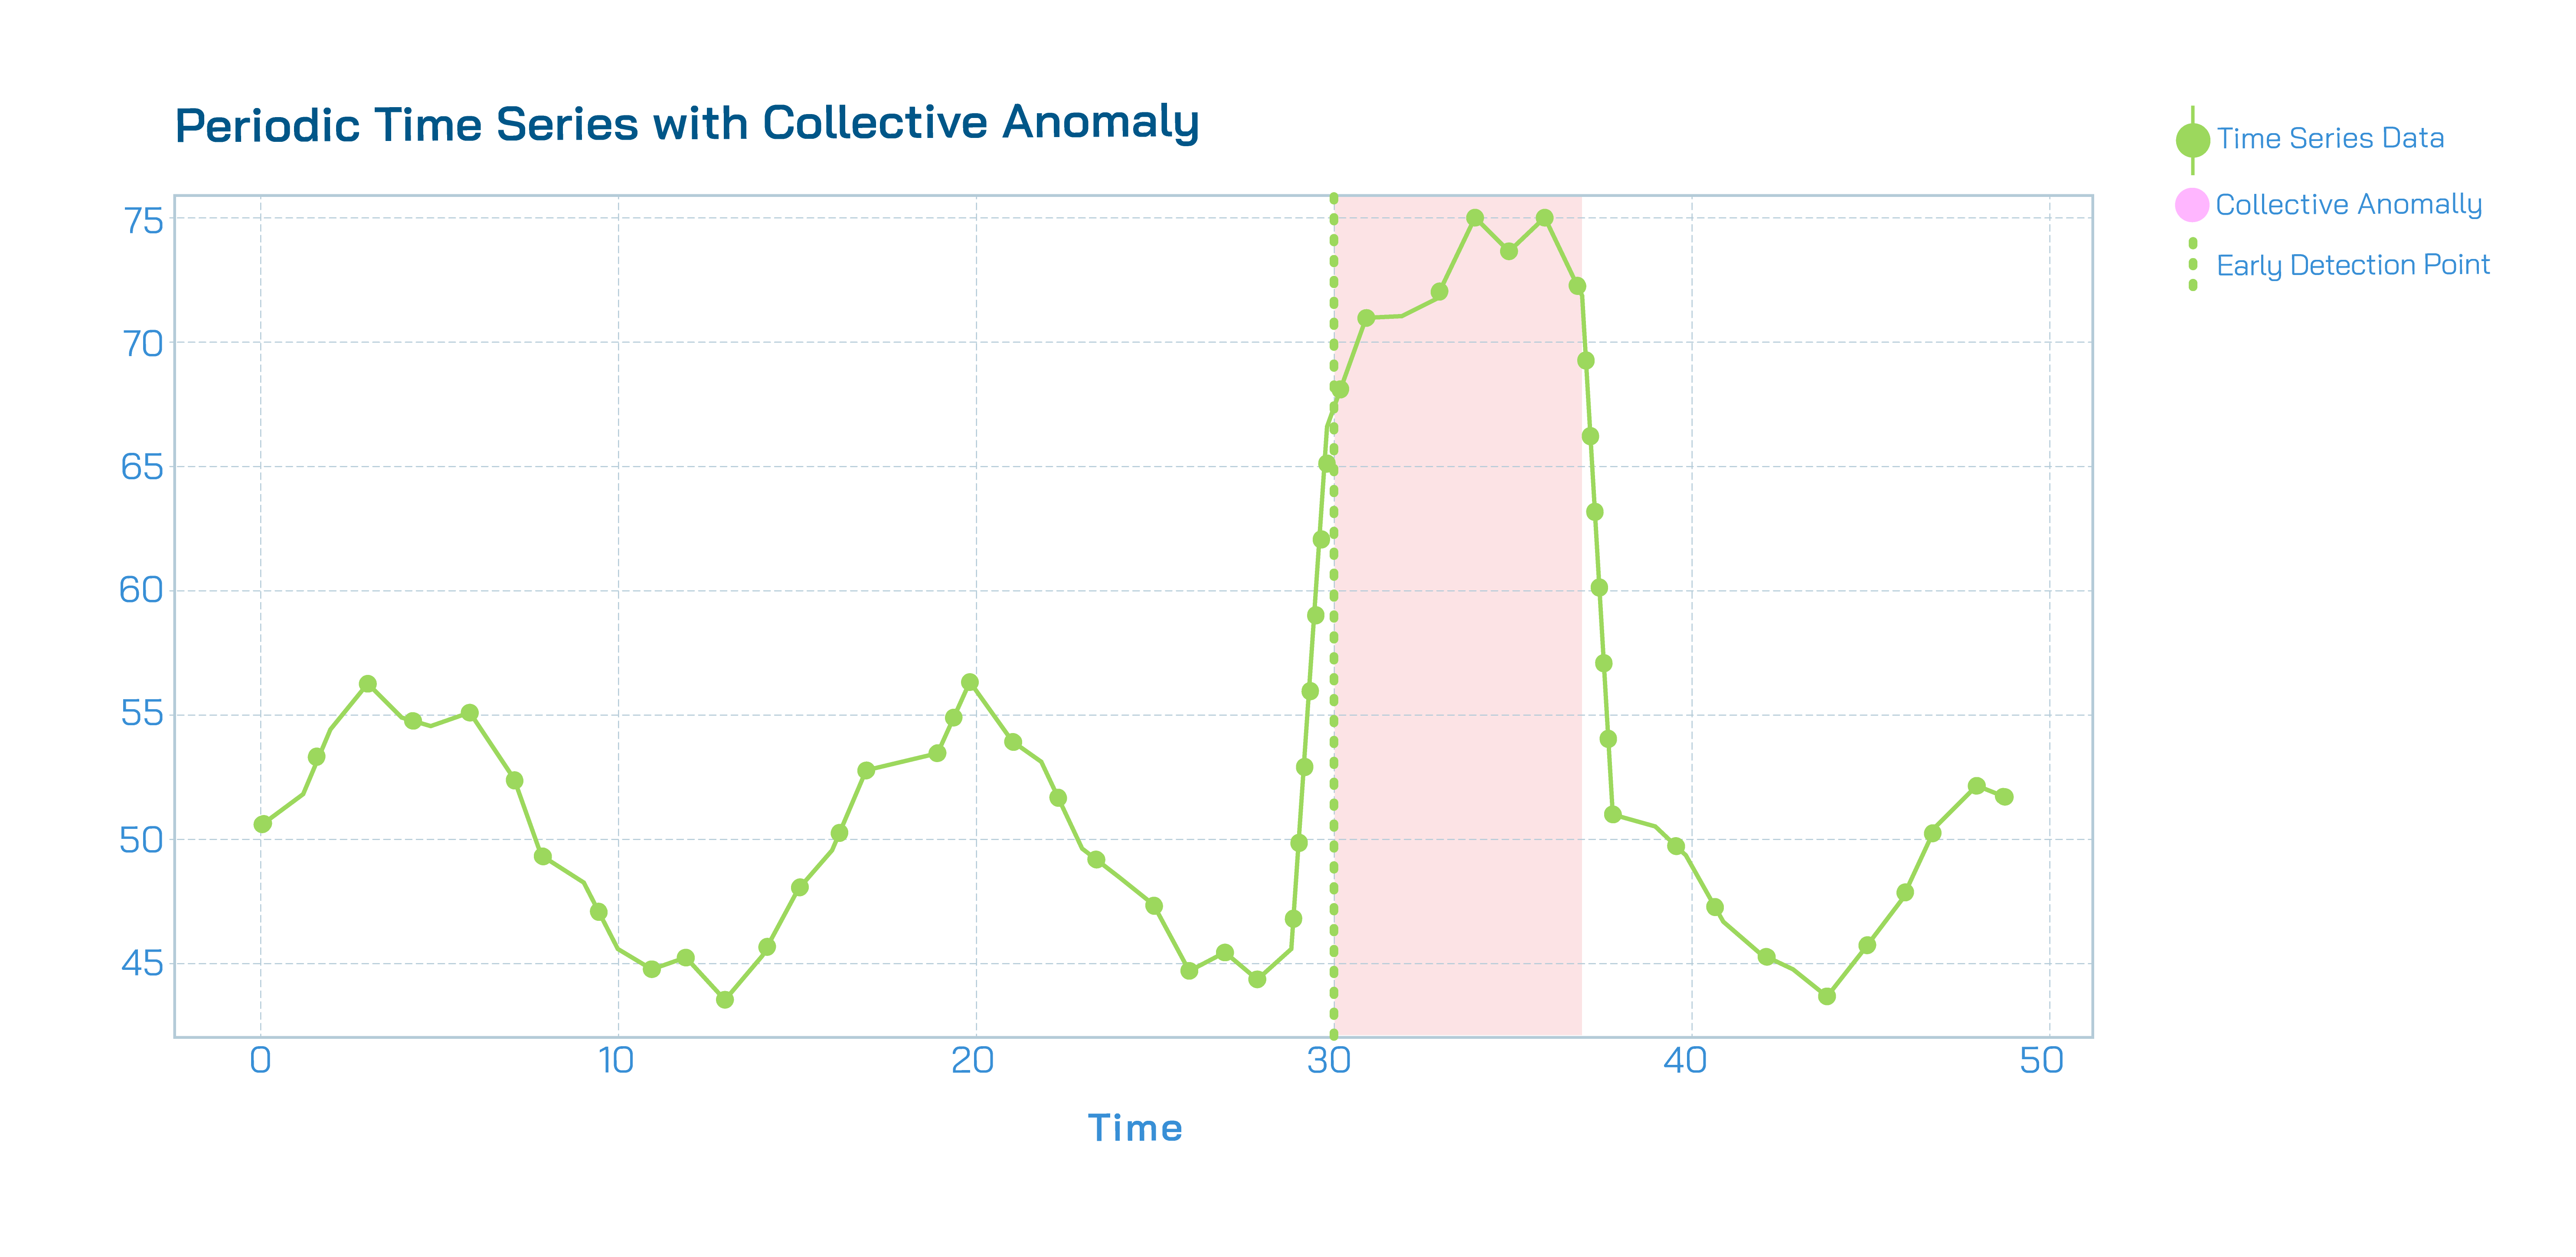
- Collective Anomalies are a group of consecutive data points that are considered anomalous as a whole since they stray from the series’ typical range of values or patterns. For instance, consistently observing high congestion events recorded over several days points towards a collective anomaly caused by network congestion. We aim to detect the early onset of collective anomalies to take an early stance.
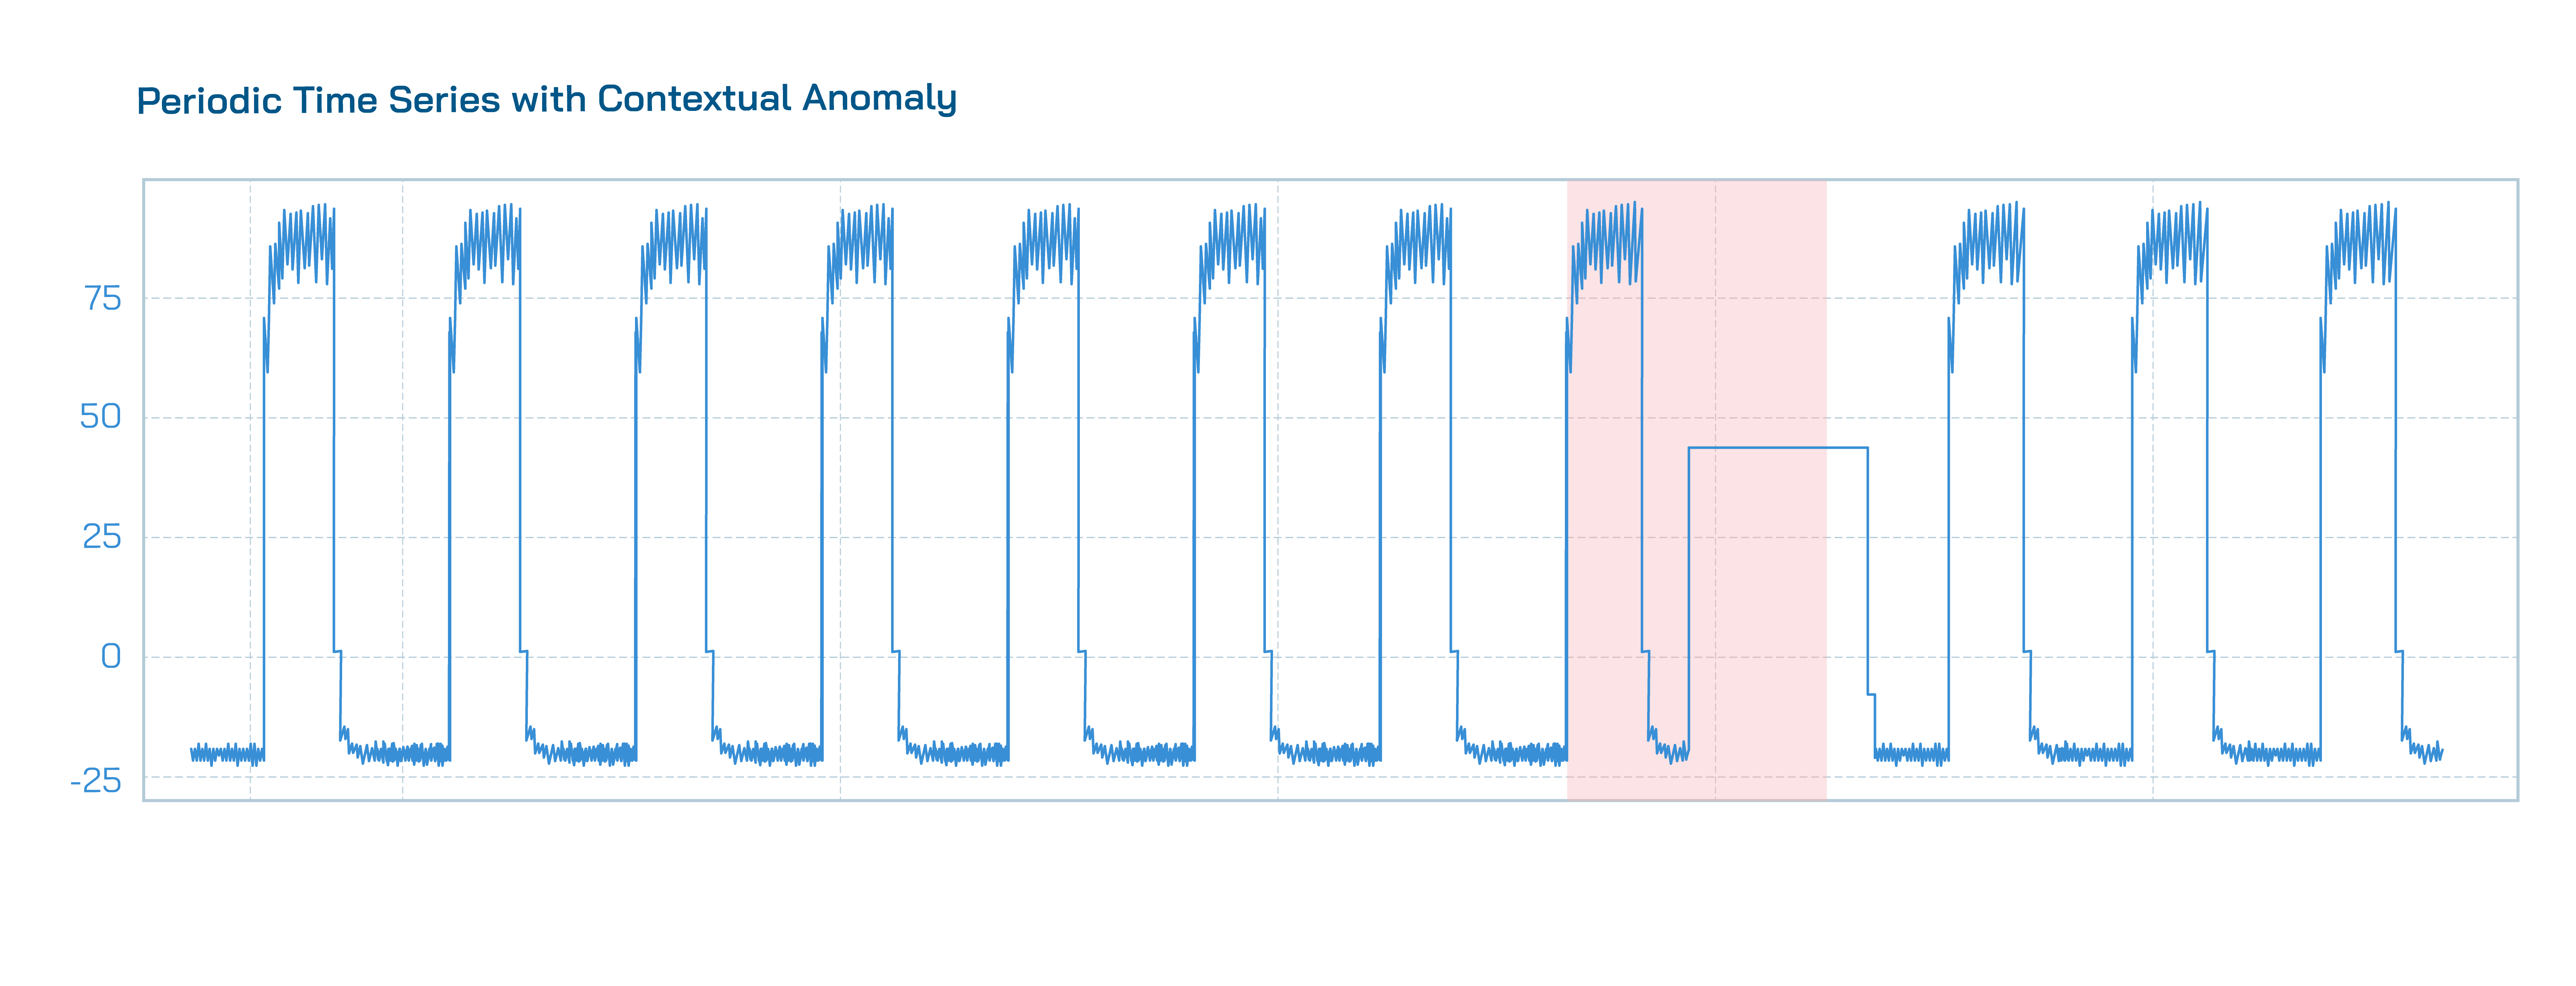
- Contextual Anomalies are a series of data points that fall within the series’ normal range but do not follow expected temporal patterns. A spike in calls to the ISP’s call center at 3 AM, when traffic is usually low, is an example of contextual anomalies.
Point and collective anomalies often surface the most urgent issues and tend to be the easiest to spot. Thus, we will focus on identifying time-series point and collective anomalies.
Real-World Results: What Our Anomaly Detection Tool Is Already Revealing
Shortly after launching our AI-driven anomaly detection tool, we began identifying changes in Wi-Fi performance data faster and more accurately. Here are some examples we’ve observed in the field.
Power Outage in the Iberian Peninsula
The 10+ hour power outage affecting Portugal, Spain, and parts of France impacted not only daily life but also Wi-Fi performance data. Once power was restored and CPE data collection resumed, our anomaly detection tool successfully identified the point anomalies, such as the spike in the number of reboots and the drop in device uptimes.
One unexpected benefit of this event was that the forced reboots led to an increase in average free memory on the CPEs, effectively resolving low-memory issues – without any intervention from the ISPs.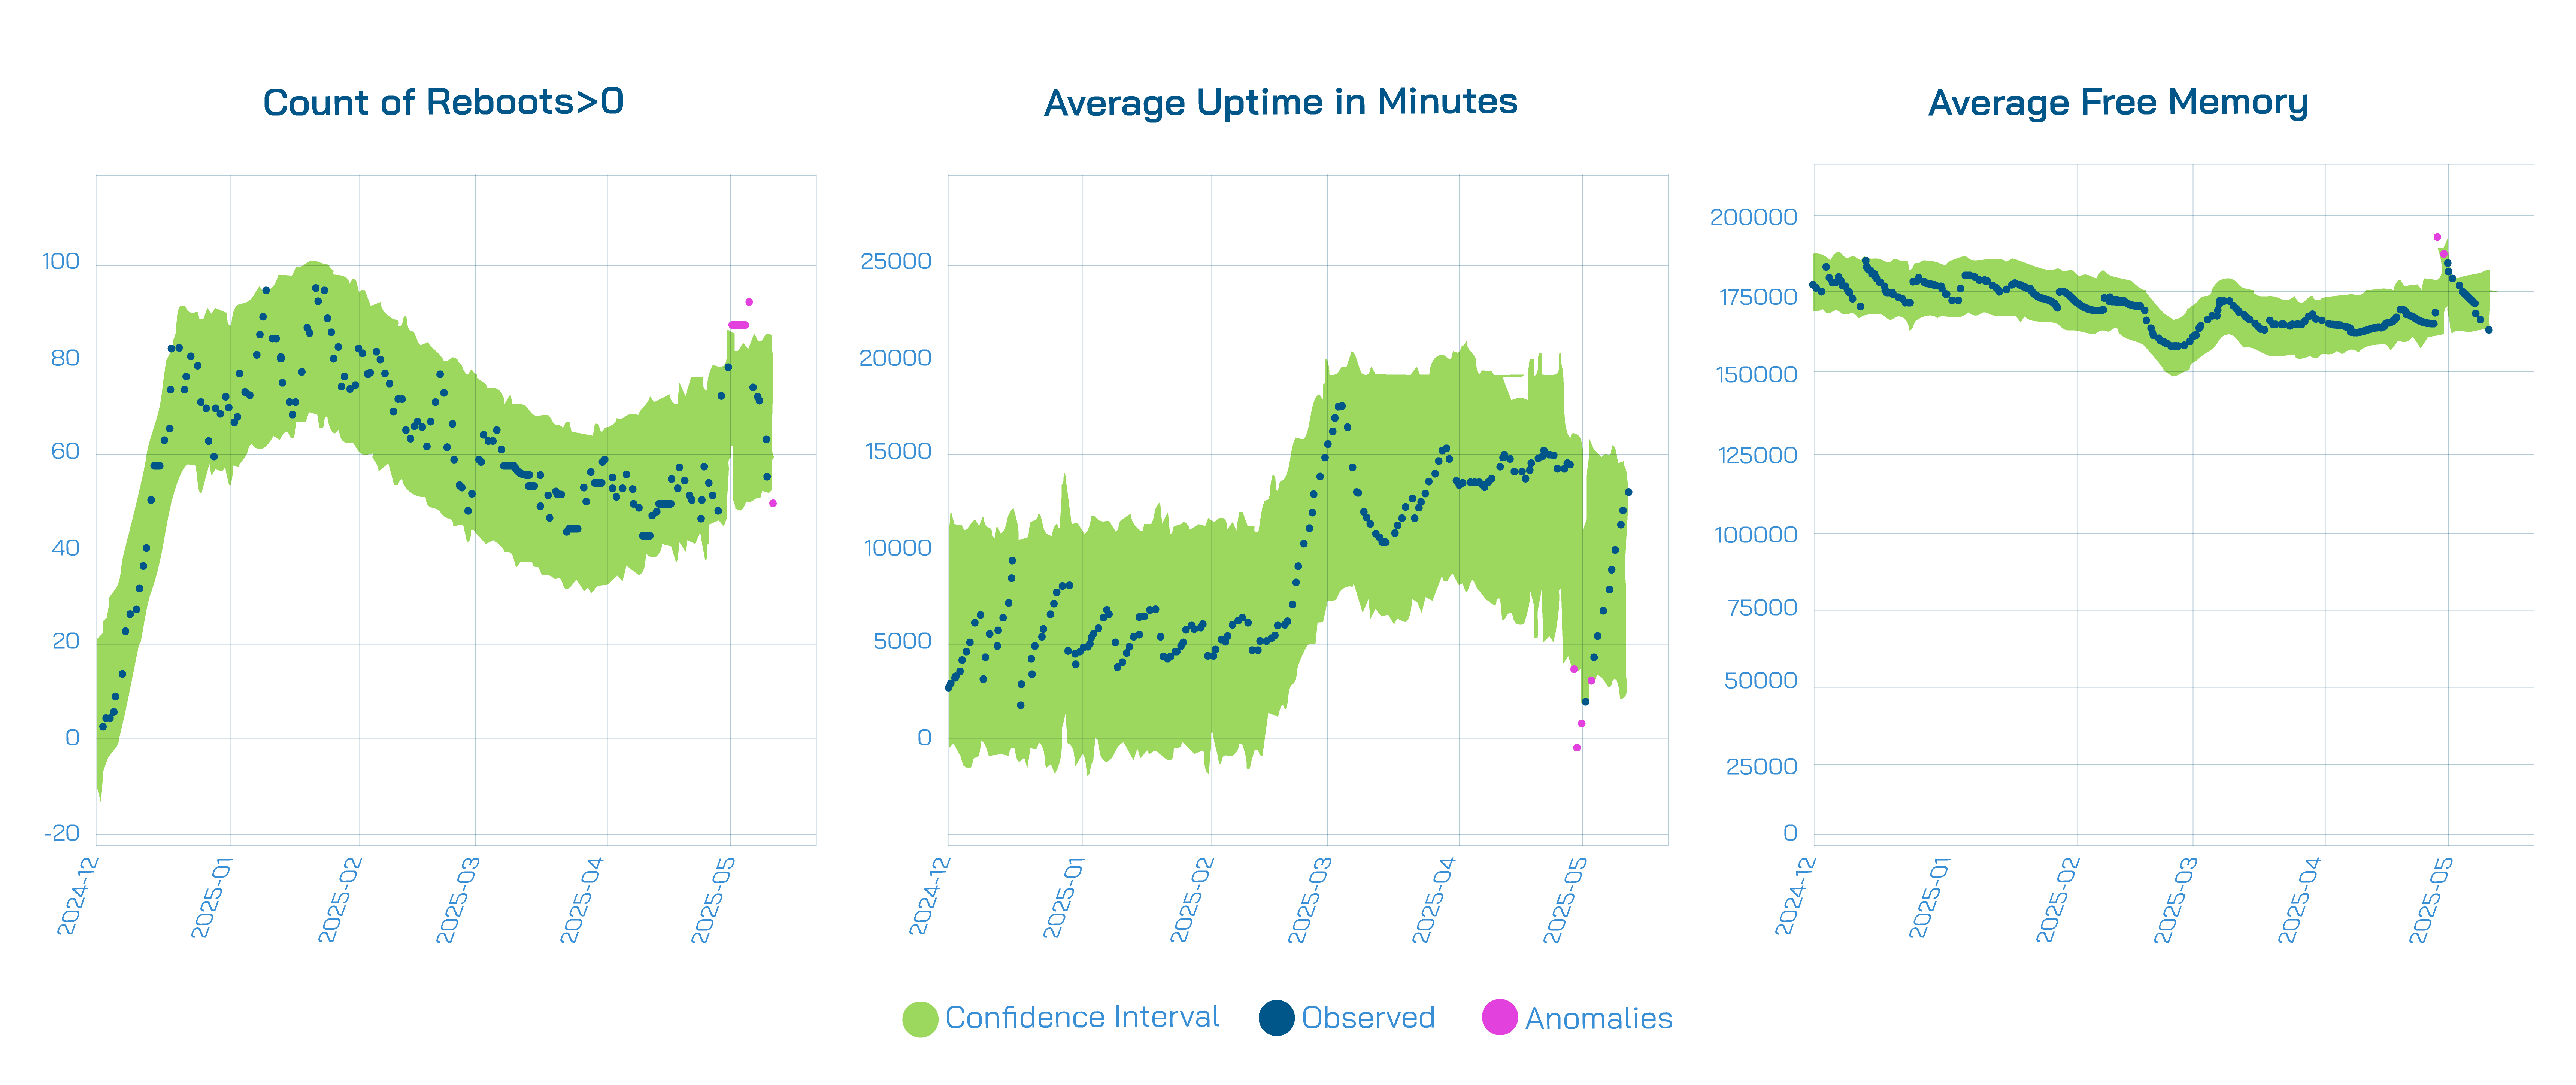
Introducing New CPE Models
When an ISP introduced a new CPE model to its customer base, our anomaly detection tool quickly flagged a significant increase in 2.4 GHz usage across the affected devices. This shift in band distribution indicated that the new device’s band steering capabilities were less effective compared to previous models, leading more users to remain connected to the slower 2.4 GHz band instead of being guided to the faster 5 GHz band.
Thanks to early detection of this collective anomaly, the ISP was able to proactively investigate the issue and escalate it to their device vendor. As a result, the vendor acknowledged the limitation and is currently working on a firmware update to improve band steering performance and restore optimal Wi-Fi experience for end users.
Firmware Upgrade Verification
During a population-wide firmware upgrade for a specific CPE model, our anomaly detection tool detected a noticeable increase in CPE reboots and restarts of the Lifemote data collection agent. These point anomalies served as indirect indicators of firmware changes across the network. By correlating this data with their ACS logs, the ISP was able to verify the rollout progress and identify which devices had successfully received the update. This helped validate the upgrade process and provided an extra layer of visibility without requiring manual checks.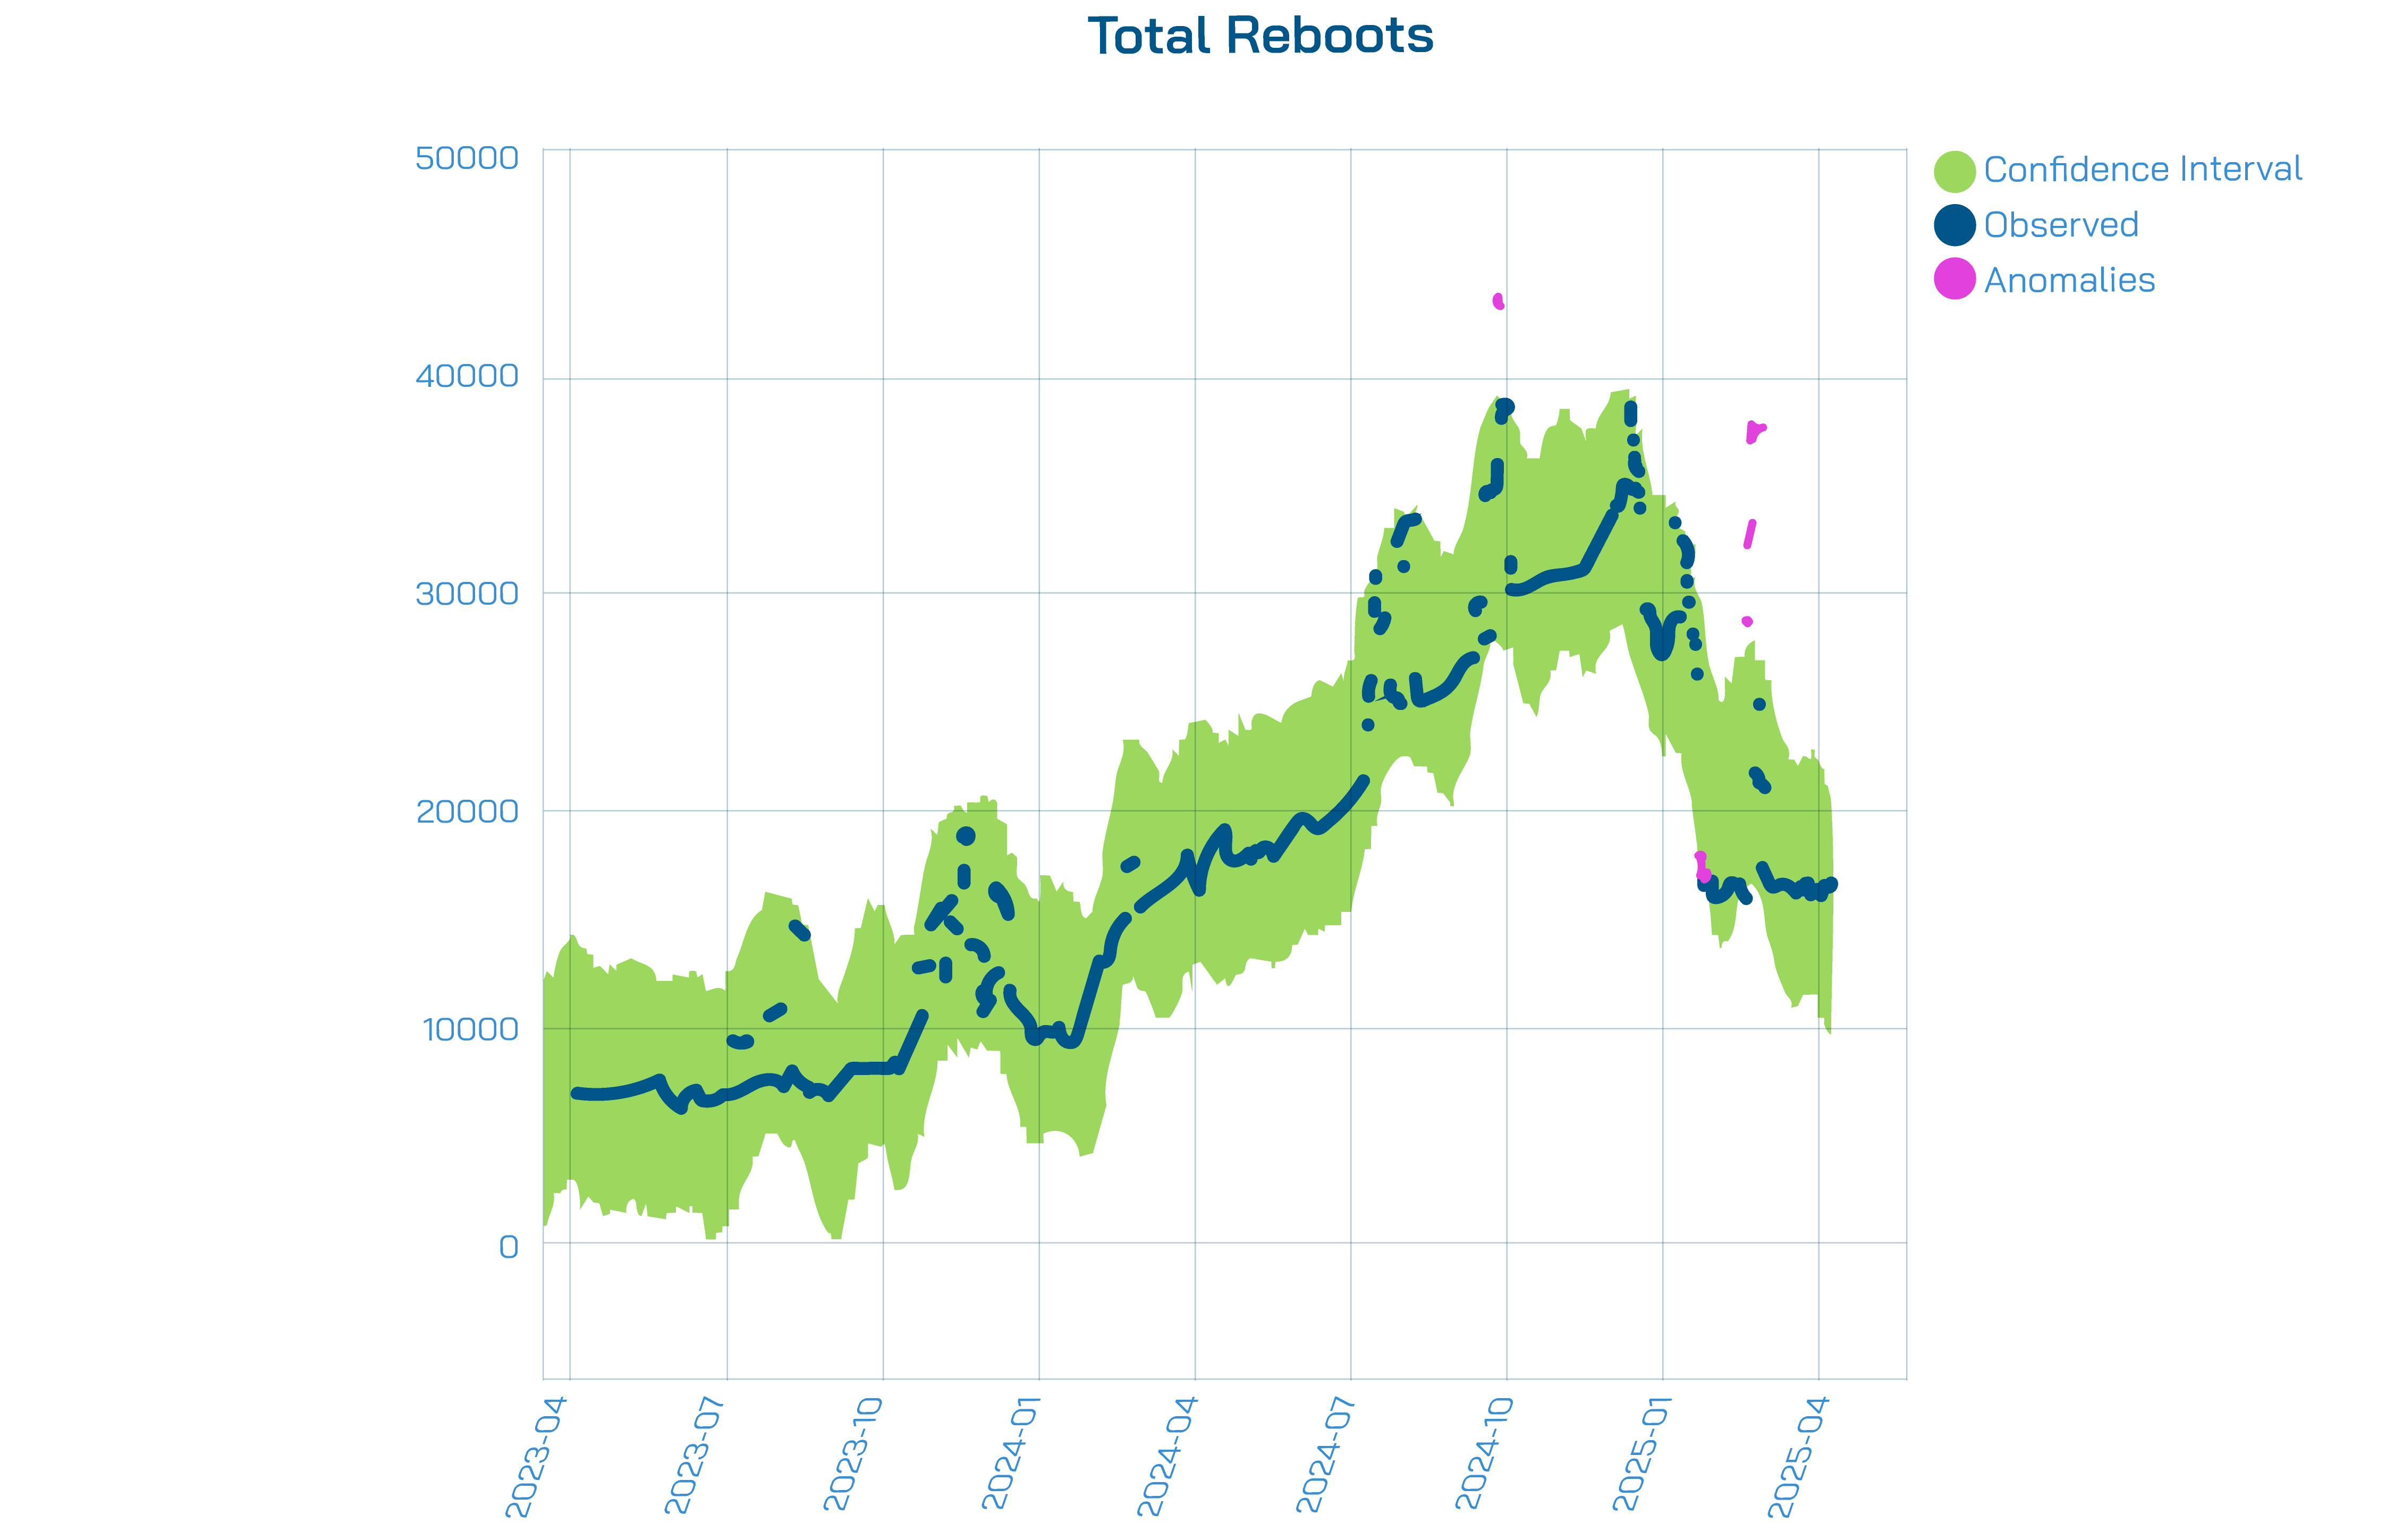
What More Can We Expect to See?
Although it’s only been a few months since the launch of our AI-driven anomaly detection tool, we are already seeing promising results. Looking ahead, we expect the tool to detect a wide range of additional use cases.
- Firmware Upgrade Impacts: For instance, a decrease in 2.4 GHz usage—like we saw with the aforementioned ISP—or a reduction in low-memory cases following a firmware update designed to improve memory management. These insights help ISPs and vendors assess the real-world impact of firmware rollouts more effectively.
- Effects of Procedural Changes by ISPs: An example might include a measurable drop in poor CPE or mesh placements following adjustments to installation procedures. This allows ISPs to verify the effectiveness of internal changes and make data-driven decisions about future improvements.
- Impact of Lifemote Algorithms: The anomaly detection tool can also track the network-level impact of new algorithms or feature releases. This enables rapid post-launch verification of changes that our research team predicts in advance, providing a feedback loop to validate and refine our models.
These are just a few of the many scenarios we expect the tool to uncover—its potential applications extend far beyond this list.
Detecting Anomalies
Time series anomaly detection poses unique challenges such as capturing temporal (time-based) dependencies between data points, distinguishing true anomalies from noise, and adapting to seasonal changes and data shifts. Traditional statistical methods often struggle with these complexities due to rigid assumptions (e.g., linearity or fixed distributions), while machine learning (ML) techniques excel by learning patterns directly from data.
ML approaches dynamically adapt to evolving data patterns, making them ideal for real-world scenarios where data behavior shifts over time. They can separate noise from anomalies through robust modelling of inputs and temporal structures.
Let’s walk through 3 famous ML anomaly detection algorithms:
1. Seasonal Trend Decomposition using Loess (STL)
STL is a machine learning method that breaks down time series data into three components:
- Trend component captures long-term gradual changes. Although the trend doesn’t need to be linear, it usually persists in a single direction: upward or downward.
- Seasonality represents the short-term periodic patterns governed by seasonal cycles (eg. daily, weekly, yearly).
- Residuals report the remaining noise and irregular influences which cannot be explained by trend or seasonality.
These 3 components can be learned through additive (y = t + s + r) or multiplicative (y = t * s * r) modelling.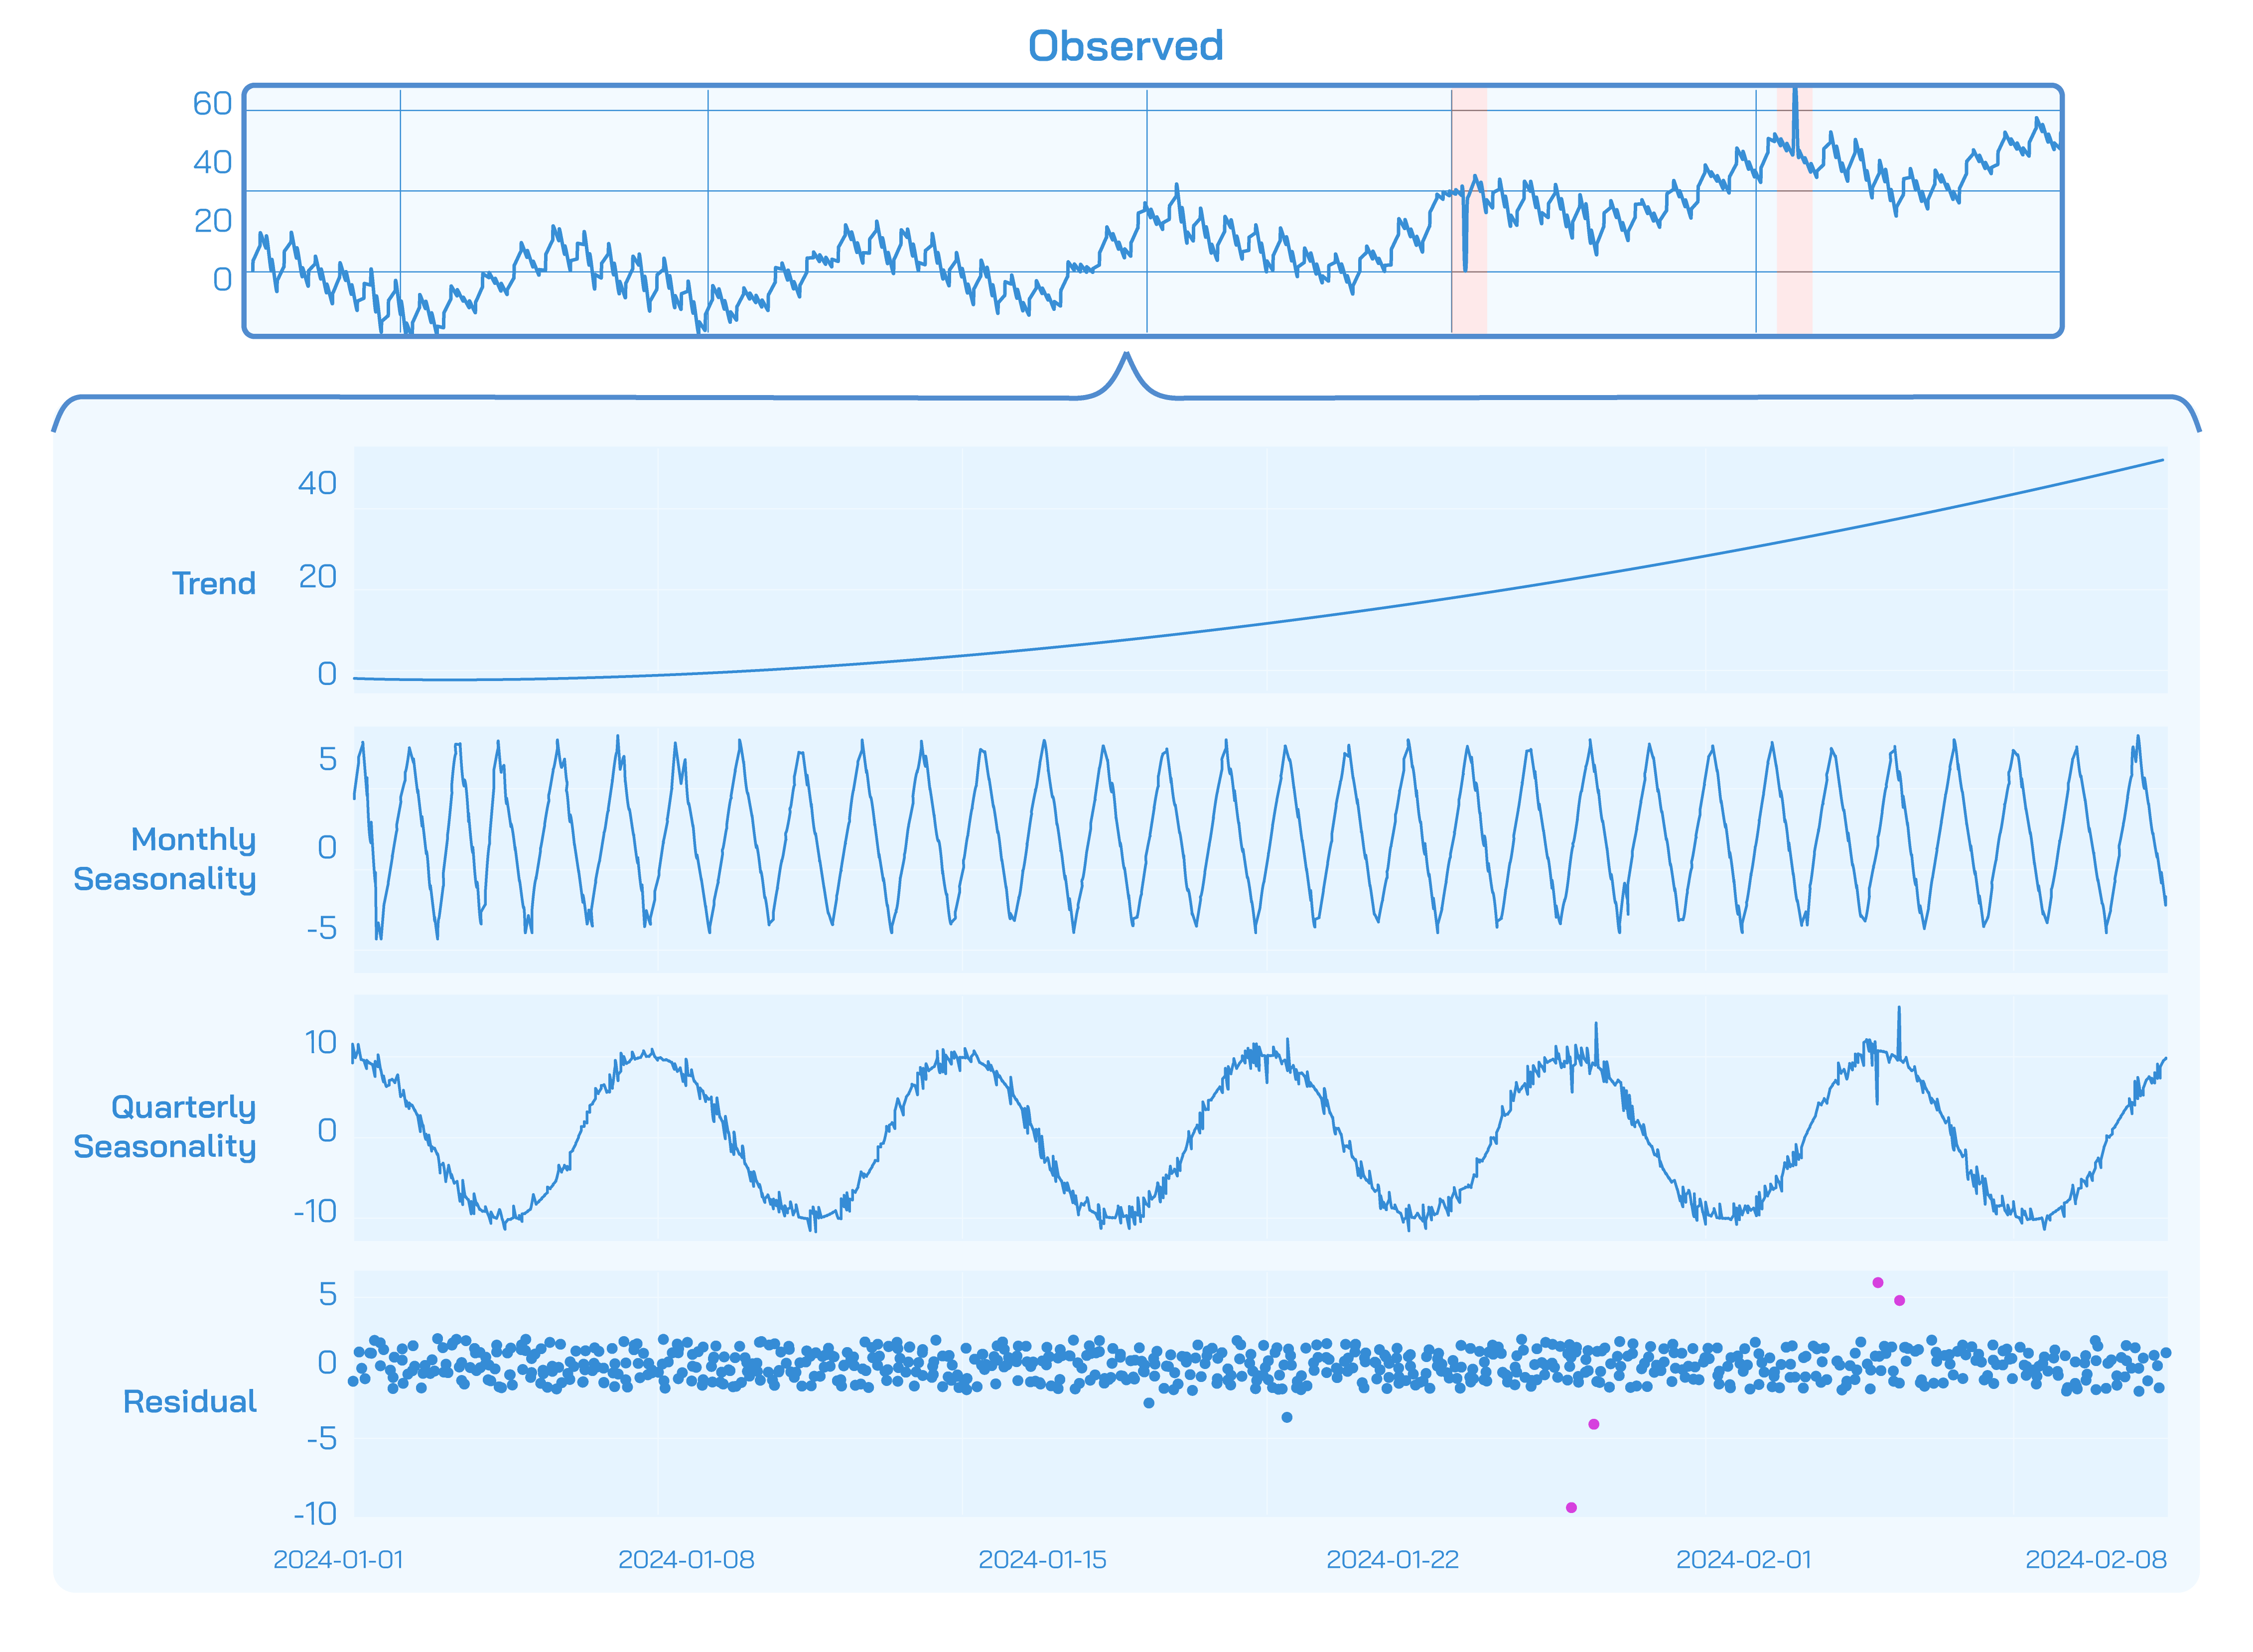
In our approach, we employ STL modeling in a regression framework to detect both point anomalies and the onset of collective anomalies. The method works by comparing actual time series observations against STL-generated forecasts, flagging significant deviations as anomalies.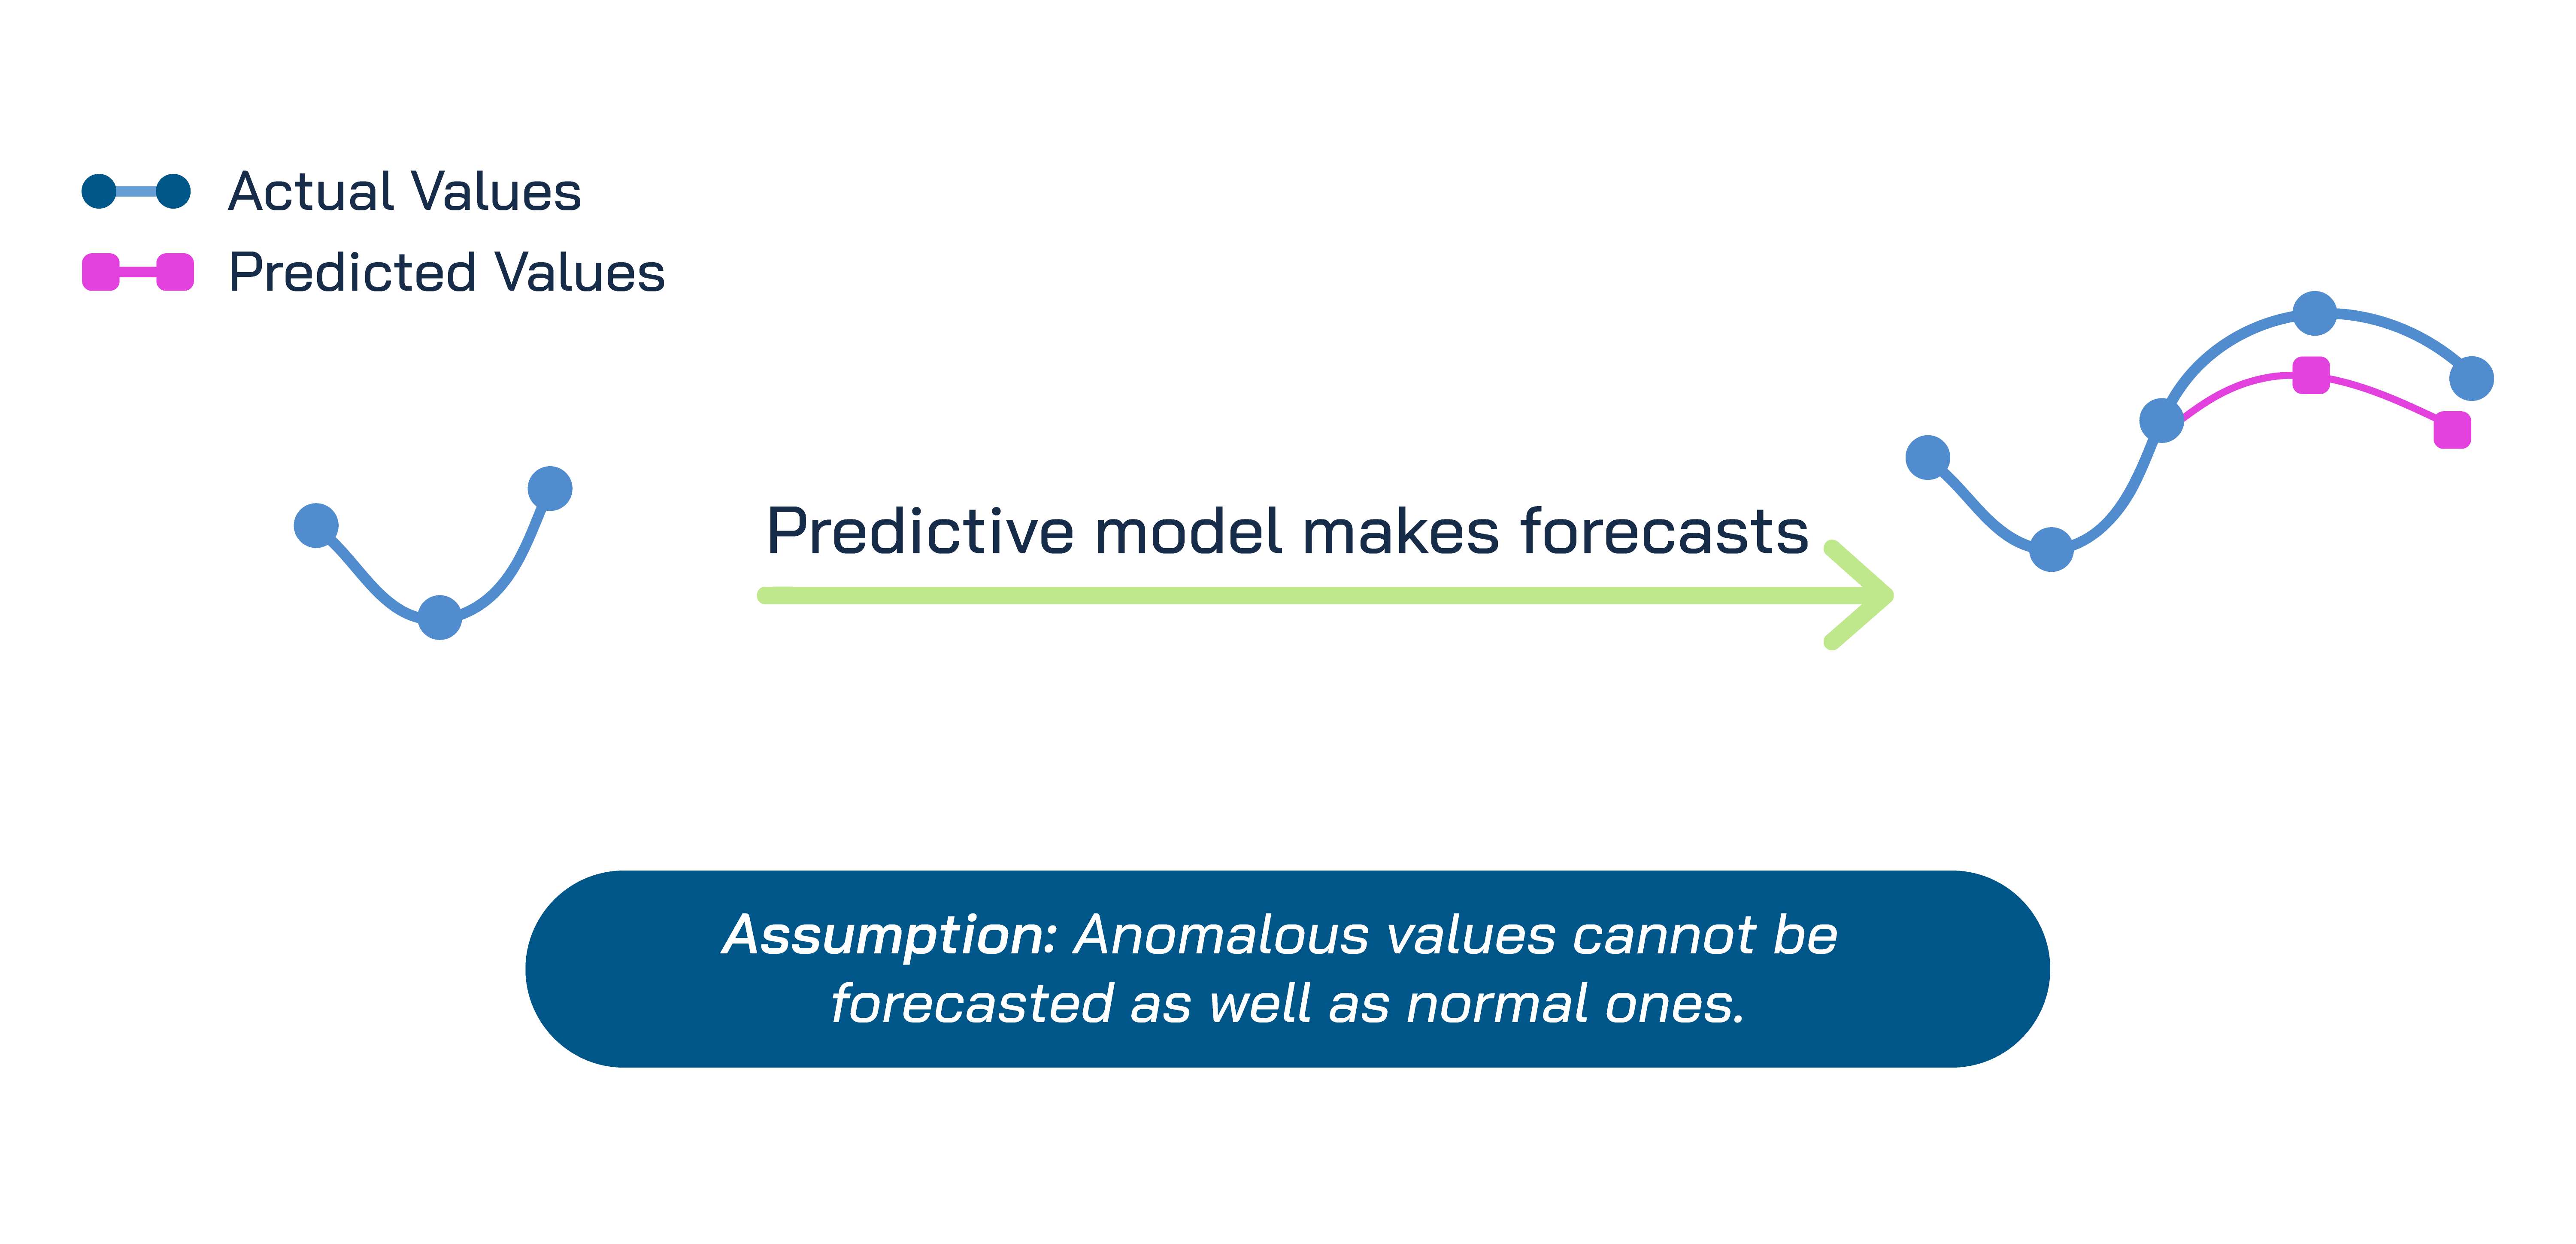
Our implementation accounts for multiple seasonal patterns, namely weekly, monthly, and quarterly cycles. Furthermore, we incorporate a 4th component in the decomposition to represent known events like holidays and firmware rollouts. To ensure robustness, we bootstrap 1,000 STL models to generate confidence intervals around predictions, then classify any observations falling outside these bounds as anomalies. Beyond binary detection, we quantify anomaly severity by measuring the magnitude of deviation from expected values, providing actionable insights on urgency and prioritization.
2. Isolation Forests
Isolation Forests method treats anomalies like needles in a haystack. The easier it is to “isolate” a data point from the rest, the more likely it’s an anomaly. Isolation forests are decision trees that randomly split data until anomalies are separated. They are fast and efficient on larger datasets. However, they don’t understand the temporal relationship in a time series input, thus they can be confused by time offsets.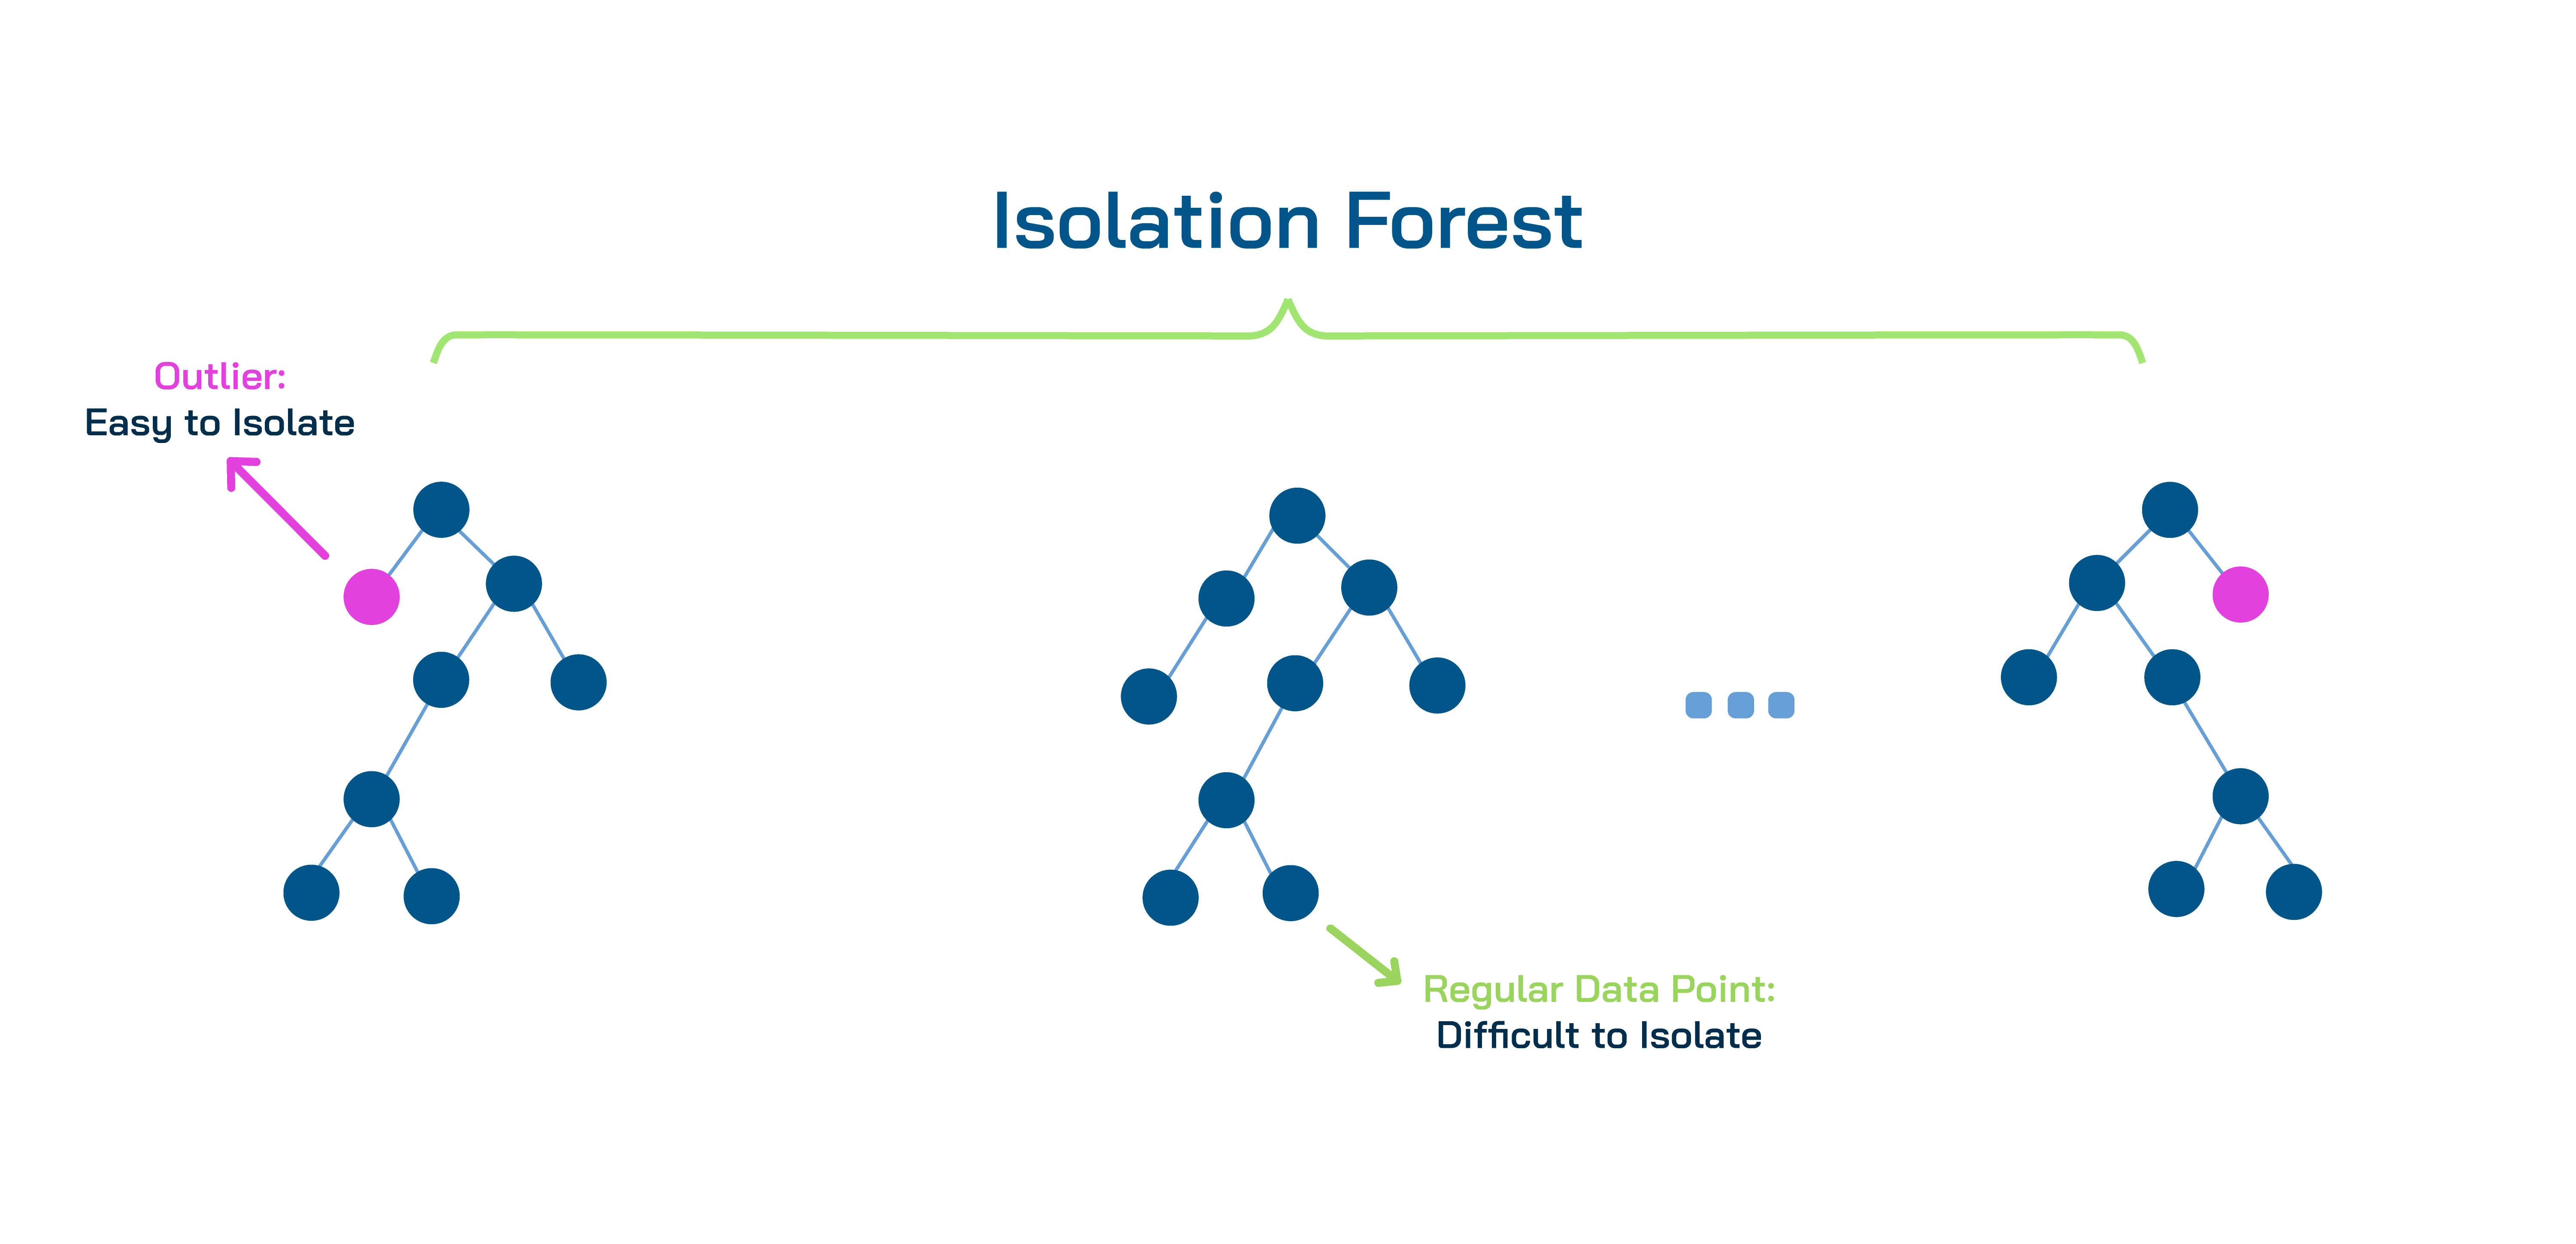
Isolation forests are ideal for identifying point anomalies, whereas collective and contextual anomalies might be difficult to capture.
3. Autoencoders
Autoencoders are a type of neural network that learn to compress the data into its most significant features, referred to as the latent space, and then reconstruct data. Thus, autoencoders are considered to be an unsupervised machine learning technique since they don’t require anomaly labels.
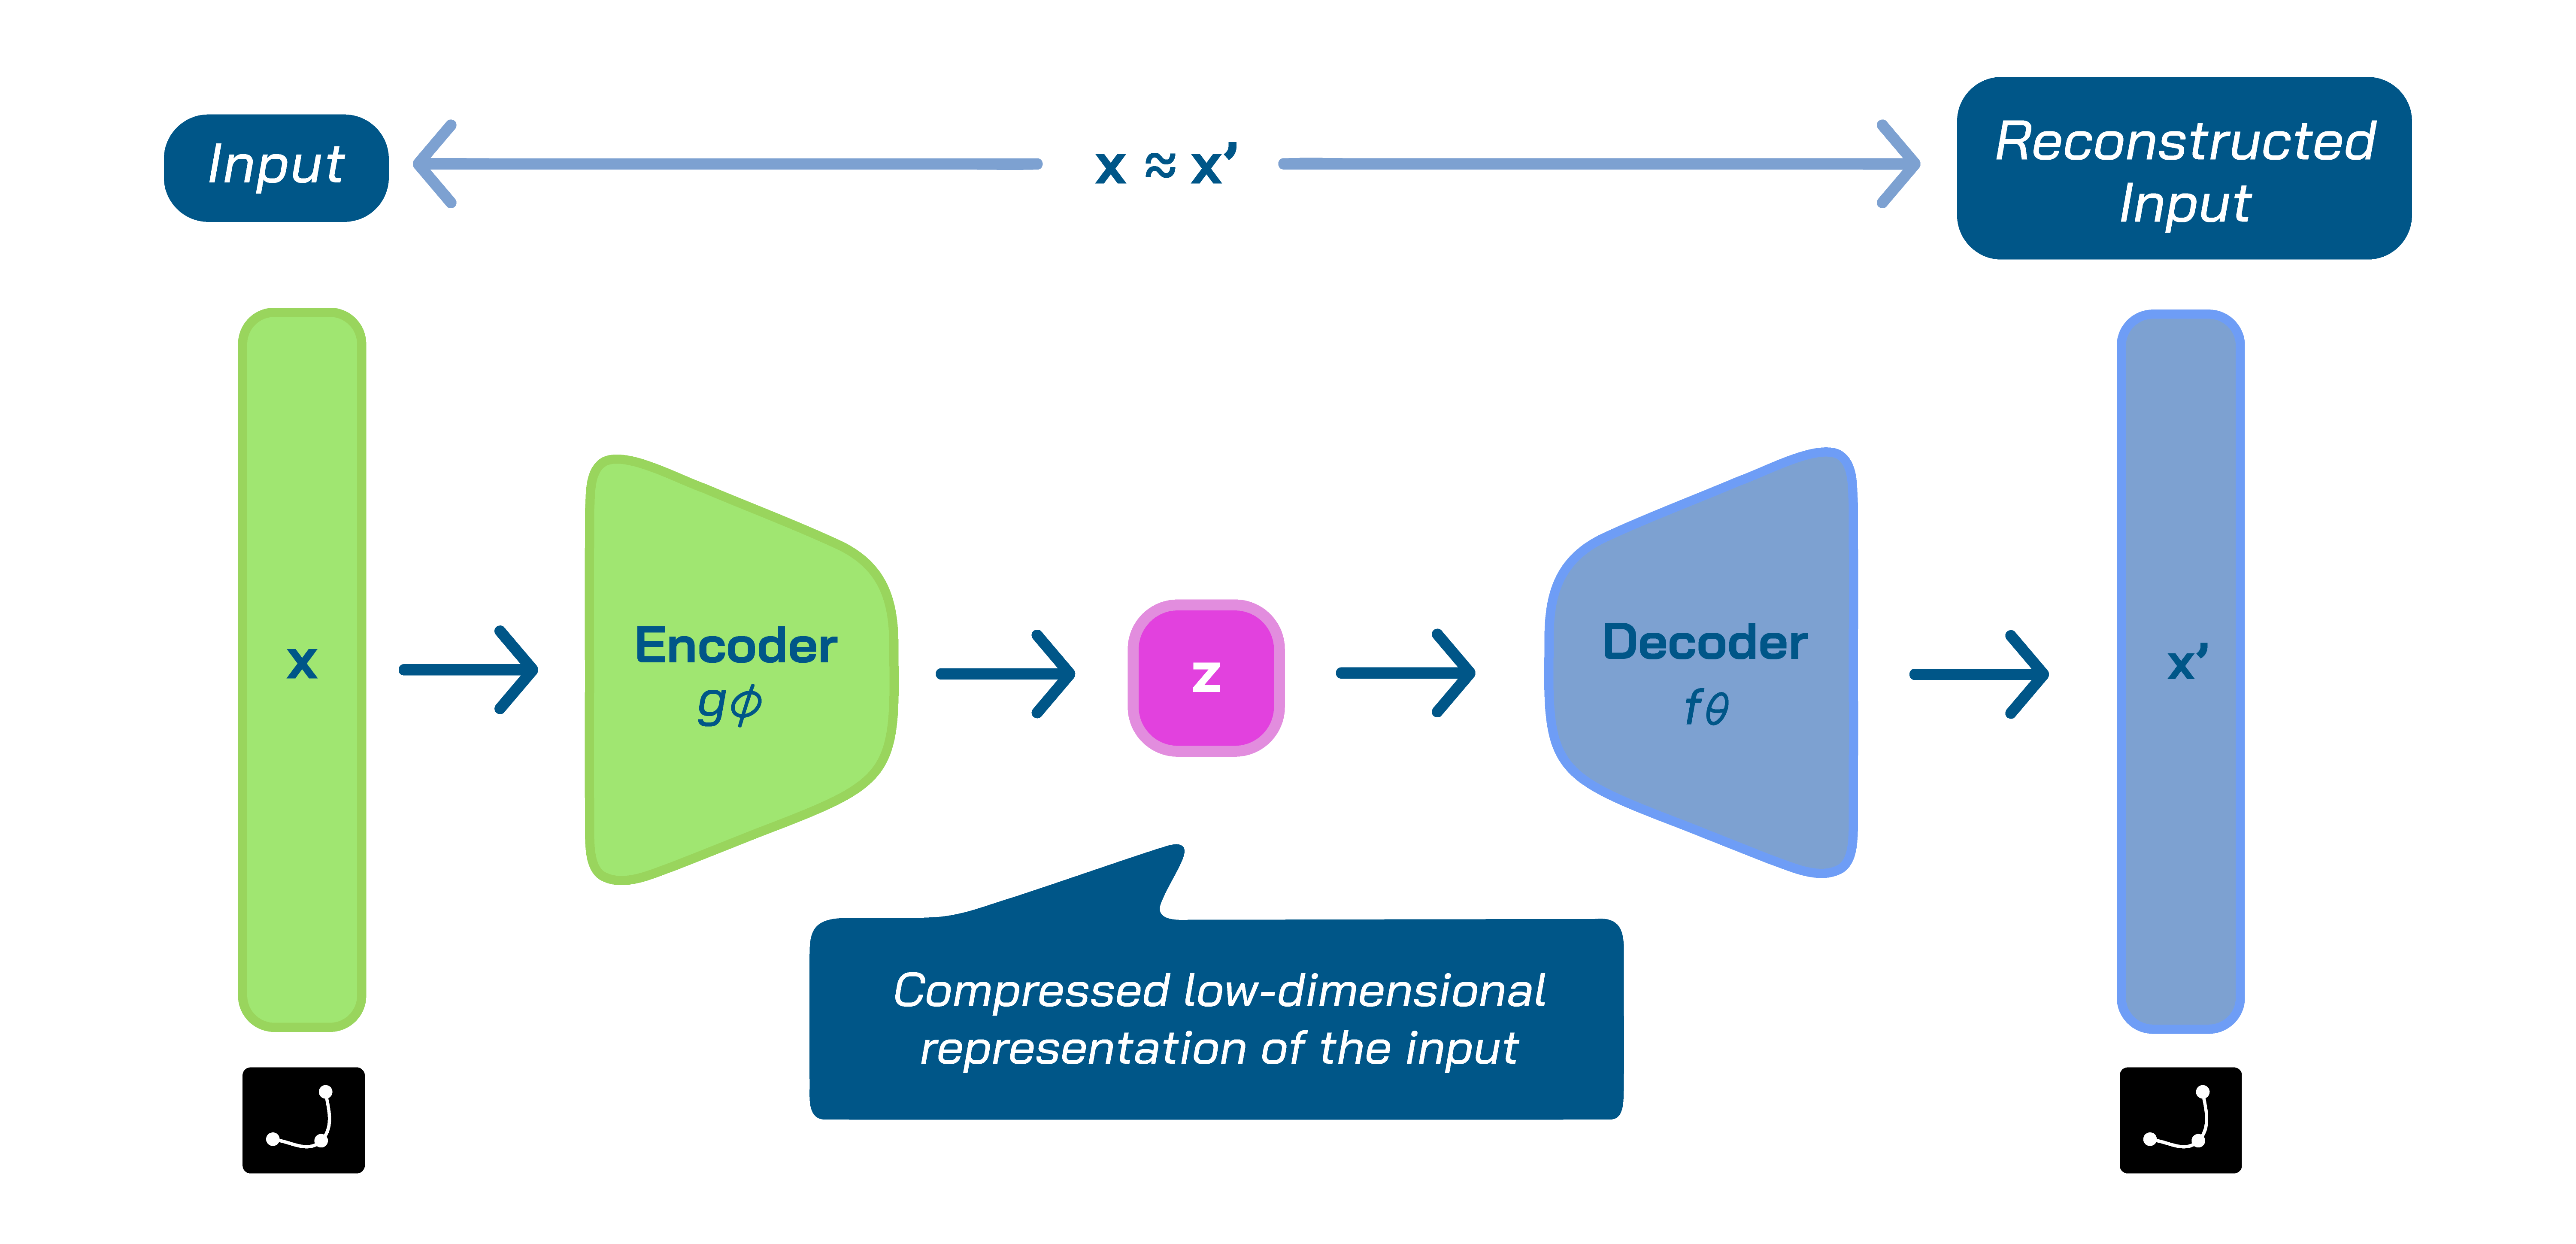
Anomaly detection via autoencoders rely on the accurate compression of non-anomaly inputs. Since they are trained on a dataset where anomalies are rare, they capture the usual patterns of the inputs in their compressed latent space. However, the trained autoencoder struggles with the reconstruction of an anomaly input after compressing it, as they don’t follow the common patterns of the inputs. Thus, autoencoders could be utilized to identify anomalies through recording of the reconstruction error. High reconstruction error indicates an anomaly.
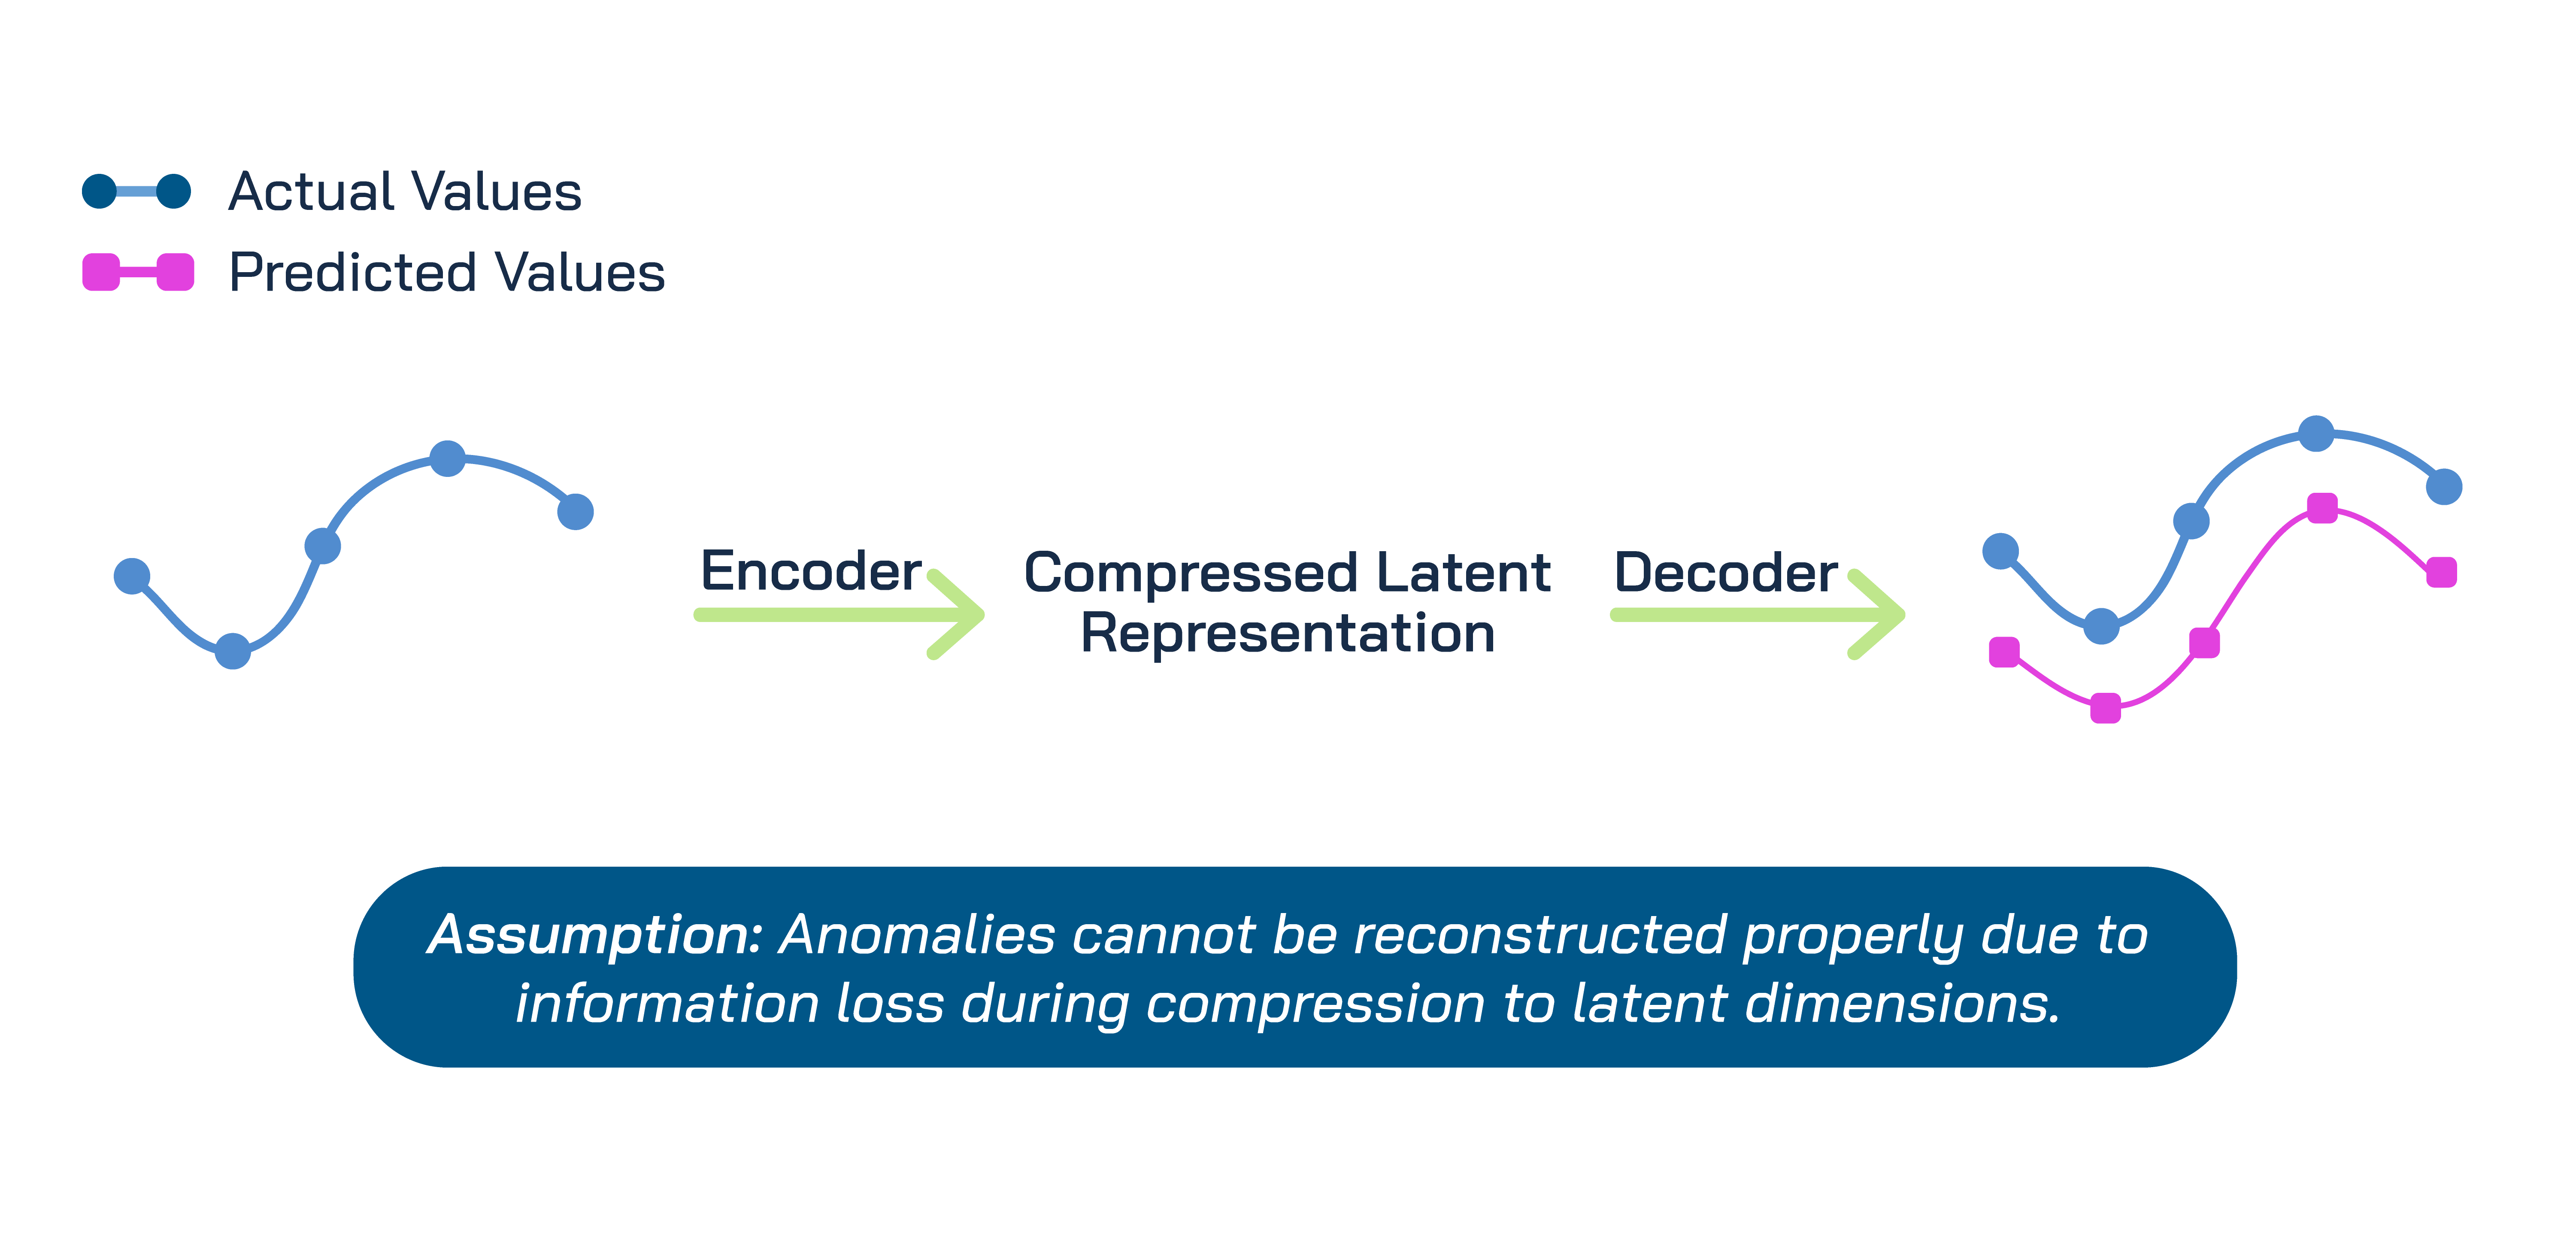
Autoencoders work best on identification of collective and contextual anomalies. They aren’t a great choice for identifying point anomalies as details can get lost in compression.
Wrapping Up
Anomaly detection isn’t just about finding problems; it is about enabling rapid resolution and proactive prevention.
Our AI-powered anomaly detection system continuously monitors Lifemote’s and our customers’ time series data, instantly flagging deviations like sudden spikes, unexplained drops, or irregular patterns. By leveraging machine learning, we detect these anomalies periodically, allowing teams to intervene before issues escalate.
The automated detection system alerts our specialized teams in Customer Support, Research, and Data Collection, ensuring the right experts are notified immediately. The result is optimized resource allocation. Our teams focus their expertise where it’s needed most, rather than manual monitoring. Ultimately, this AI-driven approach transforms raw data into actionable insights while maximizing operational efficiency.
About the Authors:
 Eylül Naz Ünsal
Customer Success Manager
eylul.unsal@lifemote.com
 Öykü Han Batum
AI Team Manager
oyku.batum@lifemote.com