Position of DSL in the broadband industry
The broadband world is heavily investing in FTTX1 technology, and the roll-out pace is getting higher every day in countries like the UK2, the Netherlands, Spain, and Norway. However, in some parts of the world, DSL3 is still the only available broadband infrastructure.
The industry is well familiar with DSL’s reliability issues, as it has been the only solution out there for many years. The instability in connection and rate reliabilities occur due to changes in conditions on the delivery line, such as the increase in attenuation, decrease in signal power, or increase in noise power, leading to an overall reduction in SNR4 margins. Even seasonal heavy weather conditions are a source of these conditional changes, which trigger the DSLAM5 to retrain itself.
Are there any other issues with DSL besides stability?
Did you know that connection and rate instabilities are not the only problems in the world of DSL? Even in a utopia where everyone gets a stable DSL service with no dropouts and constant rate delivery, bottlenecks still exist. Today, some broadband users are still on the good old DSL infrastructure; however, their newly bought Wi-Fi clients (i.e., Wi-Fi 6) are designed to support – hence demand – higher rates.
Let’s take a walk down the memory lane. Do you remember the classic Supply and Demand curve from Economics 101? This curve is directly applicable to any service with a transaction, even for those that do not involve any money. For this case, the supply is the DSL Downlink Rate delivered to the home vs. the demand is the Speed Estimate of each client inside the home. Let’s assign the DSL Downlink Rate as the controlled variable and keep it stable without any outages. Our dependent variable would be the Speed Estimate of each client, gradually increasing daily with newer and better Wi-Fi chipsets with the assumption of “perfect” coverage all around the premises. Here is what the curve would look like so far;
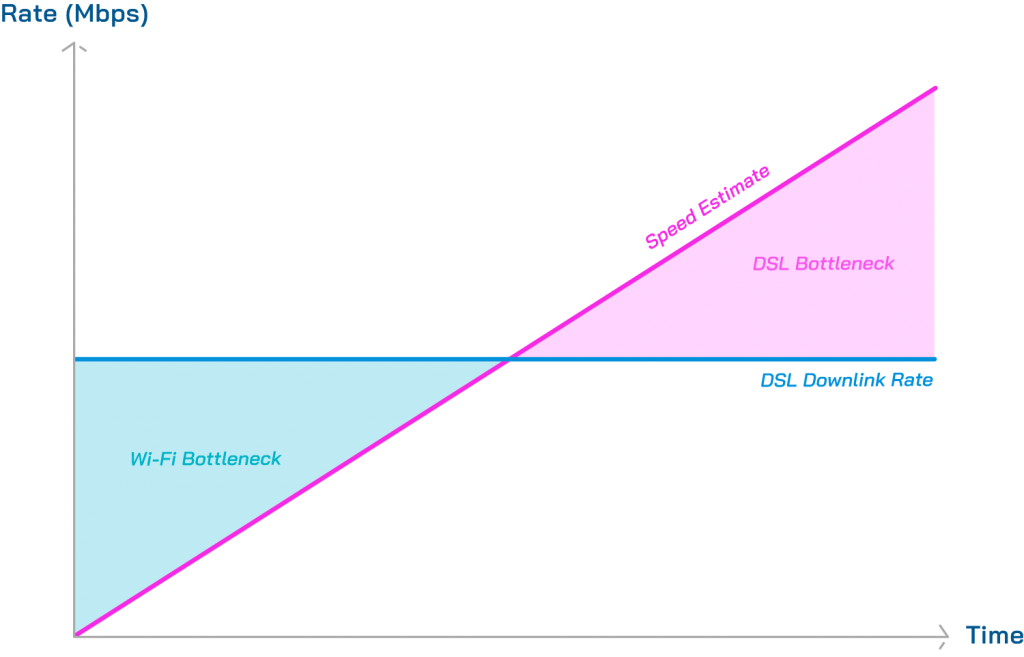
Two kinds of bottlenecks are happening on this curve, one on the left-hand side and the other on the right-hand side of the equilibrium.
- If there is a surplus of DSL Downlink Rate (i.e., the blue-shaded area) compared to the Client Speed Estimate, there is a Wi-Fi Bottleneck, meaning that the clients inside the premises are not even reaching the provided downlink rate due to Wi-Fi problems in their home.
- If there is a surplus of Client Speed Estimate (i.e., the pink-shaded area) compared to the DSL Downlink Rate, there is a DSL Bottleneck, meaning that the clients inside the premises are trying to use more rate than they are given.
Of course, the technical side of things is not that shallow, and this is merely an analogy. To further understand this imbalance in the DSL supply and demand, let’s dive deeper into these bottlenecks.
Client Speed Estimate
A client’s speed depends on various factors, one of which is the available airtime. Multiple clients share the same Wi-Fi channel for their data transmission, and available airtime refers to the portion of the Wi-Fi channel that a client can utilize for transmitting data, excluding the resource occupied by other users’ network traffic.
Another factor is the PHY rate, representing the physical layer data rate the Wi-Fi client achieves under specific network conditions. PHY rate influences the overall speed potential together with the available airtime. Yet, they are not the only determinants.
Plenty of available airtime and high PHY rates do not guarantee a client’s speed to be high, as the CPE’s6 capacity will limit transmission efficiency. The efficiency of a CPE type in transmission is determined through extensive tests in the lab environment.
In Lifemote’s pursuit of a comprehensive Client Speed Estimate, a machine-learning linear regression model is leveraged – based on the factors mentioned earlier. This approach ensures a dynamic and accurate estimation that adapts to changing network conditions.
Wi-Fi Bottlenecks
Low client speed is intricately linked to various factors, including low available airtime and/or low PHY rates, which are affected by channel congestion and/or Wi-Fi coverage issues. As elucidated in the preceding section, client speed is also subject to the efficiency limitations of the CPE capacity.
In other words, Client Speed Estimate falling below the DSL Downlink Rate at any moment shows potential hurdles within the Wi-Fi medium – a scenario where the client is bottlenecked by Wi-Fi problems.
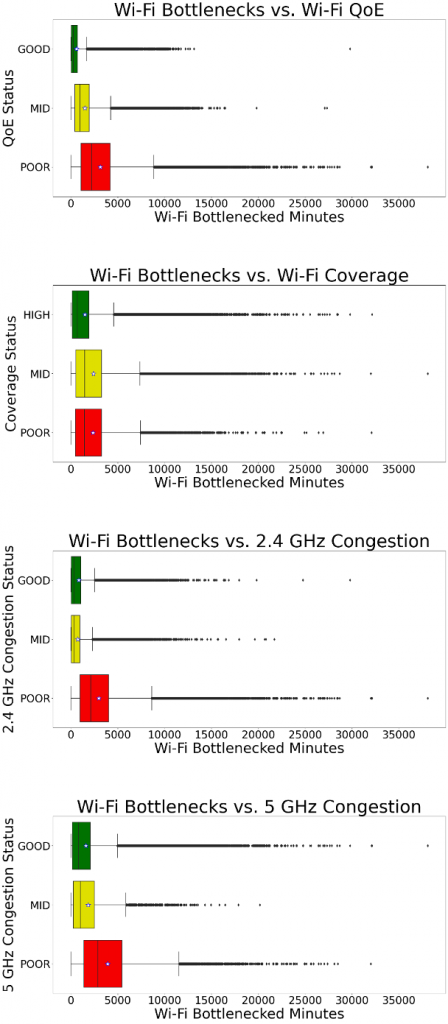
The graphs below show the weekly distribution of Wi-Fi bottlenecks in an environment for a device type population for kinds of Wi-Fi problems, namely Wi-Fi coverage, congestion in the 2.4 GHz and the 5 GHz Wi-Fi bands, and Quality of Experience (QoE).
Every factor compared is further divided into three categories based on the severity of the problem, from the worst to the best. The x-axis being the Wi-Fi bottlenecked minutes, the box plots show that as the severity of the given problem deepens, from GOOD levels of Wi-Fi congestion and Wi-Fi QoE and HIGH levels of Wi-Fi coverage to the POOR levels of all, the number of Wi-Fi bottlenecked minutes increases. The Wi-Fi QoE algorithm utilizes the clients’ speed estimates like Wi-Fi bottlenecks. Hence, they are highly correlated with each other, as expected. However, a better correlation between Wi-Fi bottlenecks and Wi-Fi Congestion is observed compared to the correlation between Wi-Fi bottlenecks and Wi-Fi Coverage. This finding indicates that a degradation in the available airtime due to channel congestion has a higher impact on estimated speed – hence the Wi-Fi bottleneck – than a degradation in PHY rate due to poor coverage.
DSL Bottlenecks
DSL Bottlenecks refer to the times that the DSL rate is insufficient for the requested services. While the Supply and Demand analogy makes the topic clear to the less acquainted mind, it does not truly represent the complete picture when it comes to the DSL bottlenecks. Lifemote’s DSL Bottlenecks algorithm is more nuanced and elaborate than simply comparing Client Speed Estimate with DSL Downlink Rate.
This time, actual DSL data rates, both in Uplink and Downlink, are taken into account instead of the Client Speed Estimate. Though comparing the DSL data rates directly with the DSL Uplink and Downlink Rates is the first thing that comes to mind at this point, more is needed to assess all DSL bottlenecks. The extensive tests in the lab environment establish that clients in a home start suffering long before the DSL data rates achieve the DSL Uplink or Downlink Rates. So, the DSL Bottlenecks algorithm compares the DSL data rates with a specific ratio of the DSL Uplink or Downlink Rates, where the ratio is obtained through the tests.
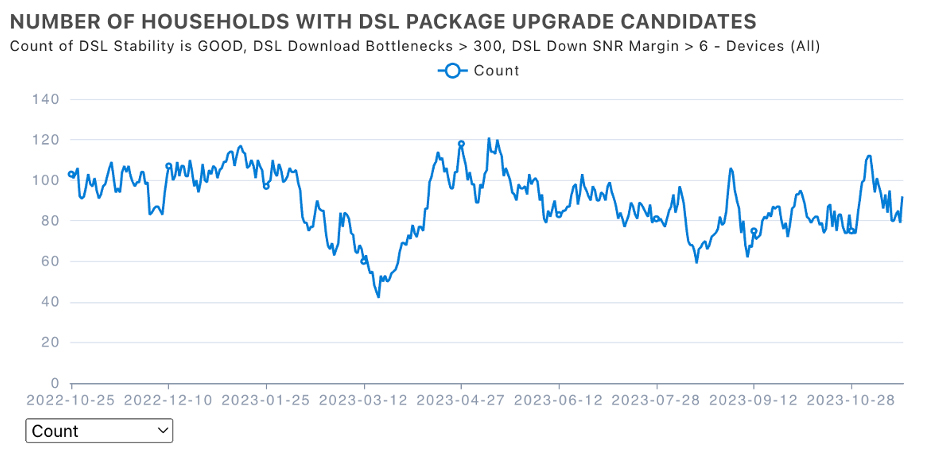
This smart algorithm, coupled with additional conditions – ensuring both the rate and connection stability as well as a substantial SNR margin in the premises – can be leveraged to continuously target customers who can benefit from a higher broadband package, as seen in the following figure.
Minimize the cost and maximize the revenue on incoming calls
Imagine a loyal subscriber of many years who recently started having DSL Bottlenecks reaches out to your Support Center – what is the solution?
- Providing a better rate through either upgrading their existing DSL Package
- Or, if possible, migrating to the Fiber Network.
You can even squeeze one of your newer CPE models into the deal to maximize the customer experience while gaining optimal revenue. This solution pack can be formulated in several different ways:
- Directly upsell to the customer from the market price to increase ARPU7.
- Give a discounted deal to boost the NPS8 after the call.
- Give a free upgrade with a 2-year contract extension to increase CLV9.
Now let’s look at the other scenario, where a customer with Wi-Fi Bottlenecks calls you and complains about their clients not getting the promised rate. A standard solution would be running a DSL line check and then deploying a DSL field technician to the premises, where neither will have any permanent solution besides increasing the OpEx10. What if your customer support had visibility on such Wi-Fi bottlenecks and could understand the problem is with the in-home Wi-Fi, not the DSL infrastructure? The visibility provided would prevent customer support from deploying unnecessary Truck Rolls and decrease the overall OpEx.
Besides the aforementioned metrics, having such visibility will positively impact both the AHT11 and FCR12 – making this a one-call quick resolution.
Downsize the call volume altogether
To this point, the discussion was about answering reactive calls and having a quick resolution in a single call. What if you could see who has either type of bottleneck in your whole network and proactively reach out to them even before they call you? Carrying this one step further, what if neither you nor the customer call each other and have a digital solution through a SelfCare platform – aiming for a zero-call resolution?
Lifemote Networks provides more analytics regarding in-home Wi-Fi quality assurance and offers to cut OpEx and increase revenue through the rich product offering of reactive, proactive, and SelfCare.
If you would like to read more on the analytics Lifemote Networks focuses on, here is a link for our introductory blog post.
Abbreviations
1* FTTX: Fiber to the X
2* UK: United Kingdom
3* DSL: Digital Subscriber Line
4* SNR: Signal to Noise Ratio
5* DSLAM: Digital Subscriber Line Access Multiplexer
6* CPE: Customer Premises Equipment
7* ARPU: Average Revenue per User
8* NPS: Net Promoter Score
9* CLV: Customer Lifetime Value
10* OpEx: Operational Expenses
11* AHT: Average Handling Time
12* FCR: First Call Resolution
About the Authors:
 Elif Dilek Salık
Research Engineer
elif.salik@lifemote.com
 Mertkan Koca
Customer Success Manager
mertkan.koca@lifemote.com