In the exciting world of wireless connectivity, there’s a buzz surrounding the latest Wi-Fi standard, called 802.11ax or Wi-Fi 6. It’s been causing quite a stir! With Wi-Fi 6, the use of the 160 MHz bandwidth (BW) is becoming more popular, and Wi-Fi 7 will even introduce a wider 320 MHz BW. At first glance, this may seem really appealing because a wider bandwidth usually means a faster connection. However, it’s essential to consider the trade-offs involved.
Choosing a wider channel bandwidth might seem tempting, but it can actually lead to less range and coverage. Here’s why: increasing the channel bandwidth spreads the signal power over a wider frequency spectrum, resulting in weaker signal strength. It also increases the chances of interference and noise from other signals or external sources. So, when setting up your network, choose your channel bandwidth wisely to enjoy both speed and reliable coverage.
Join us as we dive into the exciting world of Wi-Fi 6 and explore the pros and cons of 160 MHz channel bandwidth. Whether you’re a tech enthusiast or simply curious about the latest advancements in wireless technology, this blog post will provide you with valuable insights to help you make informed decisions.
Also, please feel free to check out our earlier blog post on the exciting benefits of WiFi6.
Let’s get started!
Exploring the Advantages of Wi-Fi 6: Faster and More Reliable Connections for Your Everyday Needs
Wi-Fi 6 offers faster and more reliable connections, making it an excellent choice for homes, offices, and public spaces. While its advantages are most prominent at shorter distances, Wi-Fi 6 still brings significant improvements in throughput compared to previous standards. Remember, signal attenuation remains a factor that affects achievable throughput, regardless of the Wi-Fi standard being used. Now, it’s time to dive into the exciting benefits that Wi-Fi 6 has to offer.
Enhanced Speed and Reliability:
Say goodbye to buffering and lagging! Wi-Fi 6 brings a 40% increase in data throughput compared to its predecessor, Wi-Fi 5. This translates to faster and more reliable Wi-Fi connections, enabling activities like streaming high-definition videos, online gaming, and downloading large files to be smoother and more enjoyable.
Considerations for Range and Environment:
While Wi-Fi 6 offers higher throughput compared to previous standards, it’s important to note that performance at longer distances may not see a significant boost. Factors such as signal attenuation and the physical environment still influence achievable throughput. However, fear not! Wi-Fi 6’s cutting-edge technologies, like beamforming and MU-MIMO, excel in shorter distances and high-density areas, enhancing overall performance.
The Fine Print:
When operating at 5 GHz with a 160 MHz bandwidth, Wi-Fi 6 truly shines in terms of throughput. However, as the distance from the access point increases, the performance advantage of Wi-Fi 6 may not be as noticeable compared to previous standards. The effects of signal attenuation cannot be completely eliminated, but the benefits of Wi-Fi 6’s higher data rates and increased capacity are more pronounced at shorter distances.
Exploring the Pros and Cons of 160 MHz Channel Bandwidth
It’s a well-known fact that as the channel bandwidth increases, the coverage area decreases. This means that while you might enjoy blazing-fast speeds with 160 MHz channels, you might also experience a decrease in the overall coverage. In fact, according to Lifemote population analytics, clients connected to Wi-Fi 6 access points (APs) operating at 5 GHz with 160 MHz BW are facing severe poor coverage more often than those using 80 MHz channels.
To gain a comprehensive understanding of the situation, we’ve conducted a thorough examination of the Wi-Fi coverage performance of the AP. Our study compares the performance of this device when utilizing either 80 MHz or 160 MHz BW in the 5 GHz Wi-Fi band. By delving into the real-world implications of these different channel options, we hope to shed light on the optimal choice for your specific needs.
Discuss the test results and performance of Wi-Fi6 connected to the AP at 5 GHz
In our blog post, we conducted some testing on a Wi-Fi 6 client. We wanted to see how it performed using different configurations and in various locations. To do this, we used 80 MHz and 160 MHz BW configurations while keeping the client in specific spots shown in Figure 1.
First, we ran tests for 5 minutes using the 80 MHz configuration. Then, without moving the client, we extended the BW to 160 MHz and continued testing for another 5 minutes. Once we finished testing at one location, we moved the client to the next test point within a home-office environment.
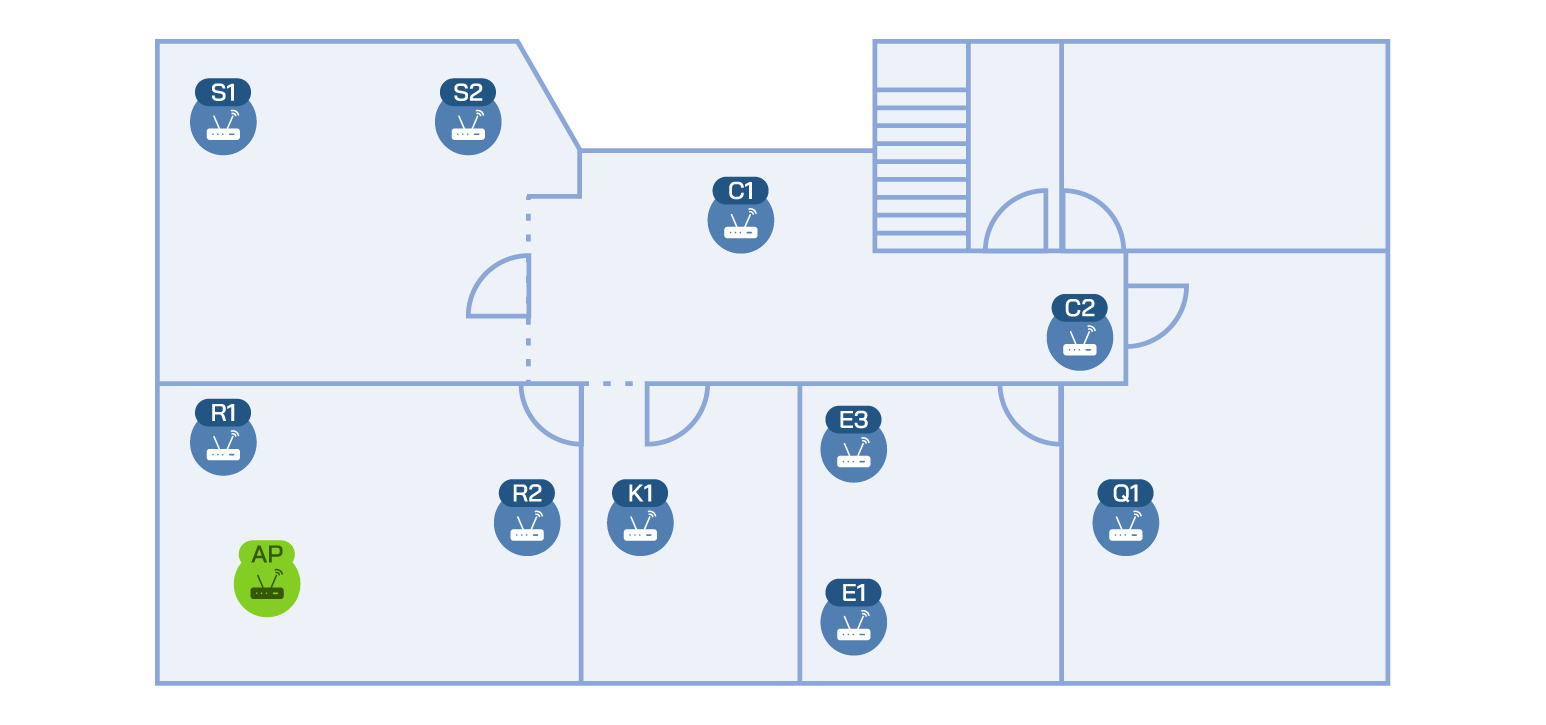
Figure 1. The test environment.
Performance of 160 MHz BW at high, mid, and poor coverage test points:
Figures 2 and 3 present our analysis carried out at various test points to evaluate coverage and bandwidth performance based on the values of Received Signal Strength Indicator (RSSI) in dBm and Physical (PHY) rate in Mbps. The color-coded shades in these figures represent different levels of coverage: green for high coverage, yellow for mid and poor coverage. To better understand the results, let’s take a look at the X-axis of Figure 2. The test points are positioned along this axis, with the leftmost point being the closest to the AP, while the rightmost point represents the furthest point from the AP, which is in a forested area. Upon analyzing Figures 2 and 3, we observed that test points R1, R2, S1, S2, C1, and K1 consistently exhibited high coverage across all points due to the high RSSI and PHY rate depicted in Figure 3. Additionally, in high coverage area, the 160 MHz BW outperformed the 80 MHz BW for these test points with high coverage. However, as we moved further away from the AP, the test points experienced mid to poor coverage. In this situation, the 80 MHz BW outperformed the 160 MHz BW. Interestingly, at test points C2 and E3 where the 160 MHz BW configuration results in mid/poor coverage, the 80 MHz BW provides higher RSSI and PHY rate, resulting in high coverage. At test point Q1, which is located at a considerable distance from the AP, both BW configurations resulted in very poor coverage.
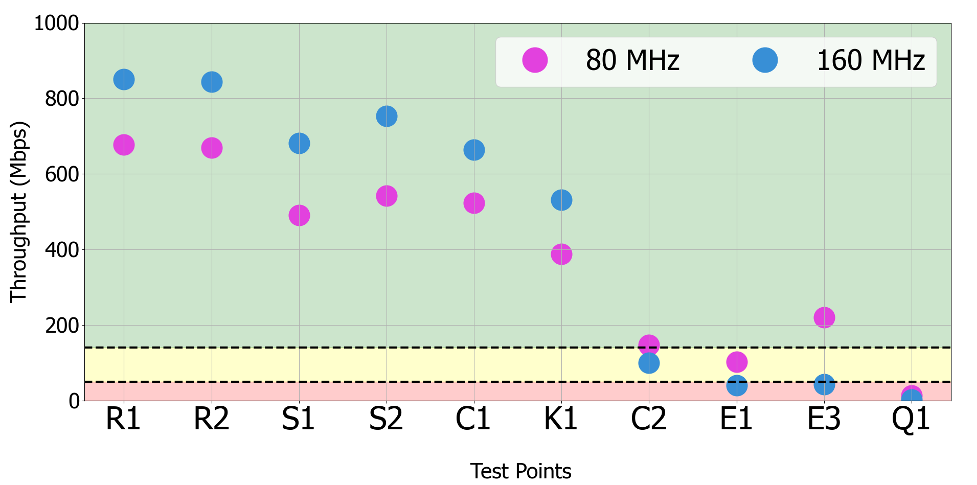
Figure 2. Throughput comparison results of 80 MHz vs. 160 MHz for Wi-Fi 6 at different test points with high, mid, and poor coverage.
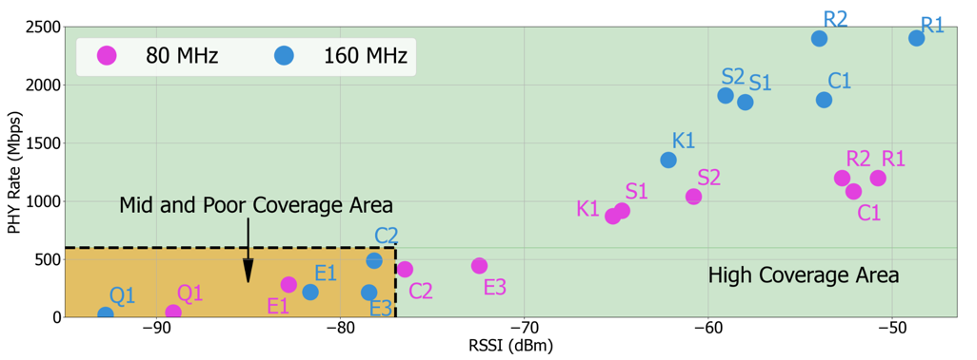
Figure 3. PHY rate and RSSI results of 80 MHz BW vs. 160 MHz BW at different test points with high, mid, and poor coverage.
To further investigate the coverage performance of 80 MHz vs. 160 MHz BW, we introduced a metric called PHY rate instability. This metric provides insights into the variations in PHY rate and the potential fluctuations in coverage. Let’s say we conduct a test at point R1 for 5 minutes and obtain 300 values for the PHY rate, measured every second. By taking the average of these values, we can determine the baseline PHY rate. The PHY rate instability then quantifies how much the measured PHY rate samples differ from this average value. It also indicates how quickly the coverage can transition from one state (high/mid/poor) to another state (high/mid/poor). A low PHY rate instability at a test point indicates that the PHY rate remains relatively stable over time. According to Figure 4, when the AP is located in the same room as the test points, both BW configurations (80 MHz and 160 MHz) exhibit optimal PHY rate stability, with PHY rate instability values very close to zero. However, as the test points move further away from the AP room (one, two, or three rooms away), the PHY rate becomes more unstable over time. Interestingly, when we are farther from the AP, the instability of the PHY rate is worse in the 160 MHz BW configuration compared to the 80 MHz BW configuration, especially in the mid coverage area.
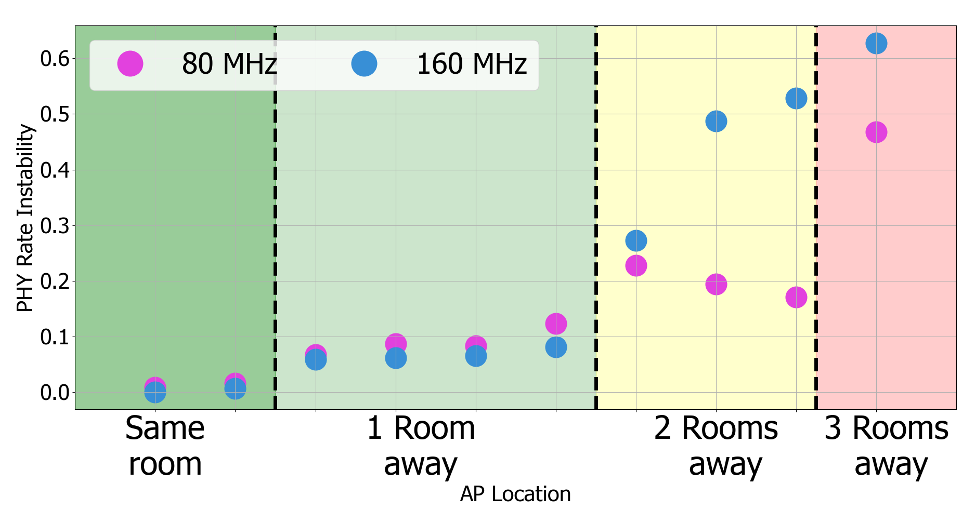
Figure 4. PHY rate instability comparison of 80 MHz BW and 160 MHz BW at different test rooms.
Don’t worry about the Wi-Fi5 Performance: Unleashing the Power of 5 GHz and 160 MHz BW!
According to our test results, we found that when the AP setting is set to 5 GHz and 160 MHz bandwidth, the throughput performance of clients supporting a maximum of 80 MHz BW is not affected. In simpler terms, if a client is connected to the AP and can only support 80 MHz, the AP’s throughput remains nearly unchanged whether it’s operating at 80 MHz or 160 MHz. Therefore, we can be confident that the Wi-Fi 5 experience will stay consistent and reliable, as most of the Wi-Fi 5 clients support up to 80MHz.
What Lifemote suggests:
Boost Your Wi-Fi Performance with Smart Bandwidth Selection!!!
To make the most of your AP in mid or poor coverage areas, we recommend limiting the bandwidth to 80 MHz for your Wi-Fi 6 clients. By configuring these clients to operate at the 80 MHz bandwidth, rather than the 160 MHz setting, users can experience an impressive boost in performance of up to 400%. This strategic adjustment will help you maximize performance and ensure a stable connection in those hard-to-reach spots.
However, don’t limit yourself to just one setting! In high coverage regions, feel free to enable the 160 MHz bandwidth for your Wi-Fi 6 clients. This will allow you to take full advantage of the router’s capabilities and experience lightning-fast speeds without compromise. Conveniently, Lifemote will show you exactly which homes should be configured to 80 and which to 160 MHz for optimum performance.
About the Author:
 Niloofar Mehrnia
Research Engineer
niloofar.mehrnia@lifemote.com
 Özgün Demir
Research Engineer
ozgun.demir@lifemote.com