It is a calm afternoon in a small seaside town, where residents are busily working away on their home WiFi. All of a sudden, a customer starts experiencing very low rates (see Figure 1) in the 5 GHz band and complains to the Internet Service Provider’s (ISP) support center.
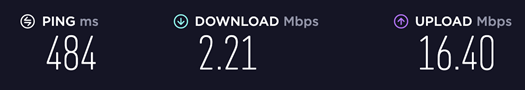
Figure 1. Speedtest result of the complaining customer
Turns out that 22 neighboring access points (APs) in the same MDU, 3 of which belong to the complaining customer, are heavily suffering from airtime fullness. Here is how Lifemote was able to pinpoint the problem with its advanced analytics for enhanced visibility.
Identifying the problem
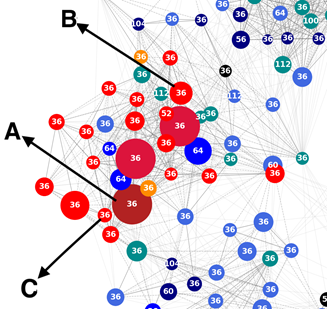
The MDU Topology of the neighborhood suffering from airtime fullness is shown in Figure 2. Each node represents an AP. Node colors refer to the airtime fullness of the node between 6 PM – 12 AM on the problem day. Node sizes indicate the data usage through that AP; whereas the numbers on the nodes are 5 GHz Wi-Fi channels of the corresponding APs. There are so many nodes in channel 36 due to the dense radar activity in the area- the town being “seaside” is relevant in that it’s commonly washed by maritime radar, which is limiting the channel options for MDUs.
As seen in the figure, nodes colored in red tones (indicating high airtime fullness) are neighboring APs; and they are all on channel 36. Therefore, it is expected that there is a common interference source in the area. Furthermore, there are 3 nodes distinguished from others with higher data usage, such as A. Our investigation suggested that one of the clients of AP-A is causing the congestion problem for the whole neighborhood.
Figure 3. depicts the correlation between data usage of the client at AP-A and airtime fullness of the 3 APs using channel 36. Airtime fullness dramatically increases with the beginning of this client’s data usage. At the Speedtest time of the customer with AP-B, airtime is more than 80% full, which explains the low rates. Similar airtime is observed for other neighboring APs, such as. AP-C. Further analysis on the given client indicates that it uses data volume with low PHY rates despite a high signal strength. The time spent by AP-B at channel 56 indicates free airtime at other 5 GHz channels. However, a few hours later AP-B changes its channel back to 36 due to radar activity and continues to suffer from congestion. Similarly, other APs in the MDU are also forced to stay at channel 36 due to radar activity and suffer from congestion.
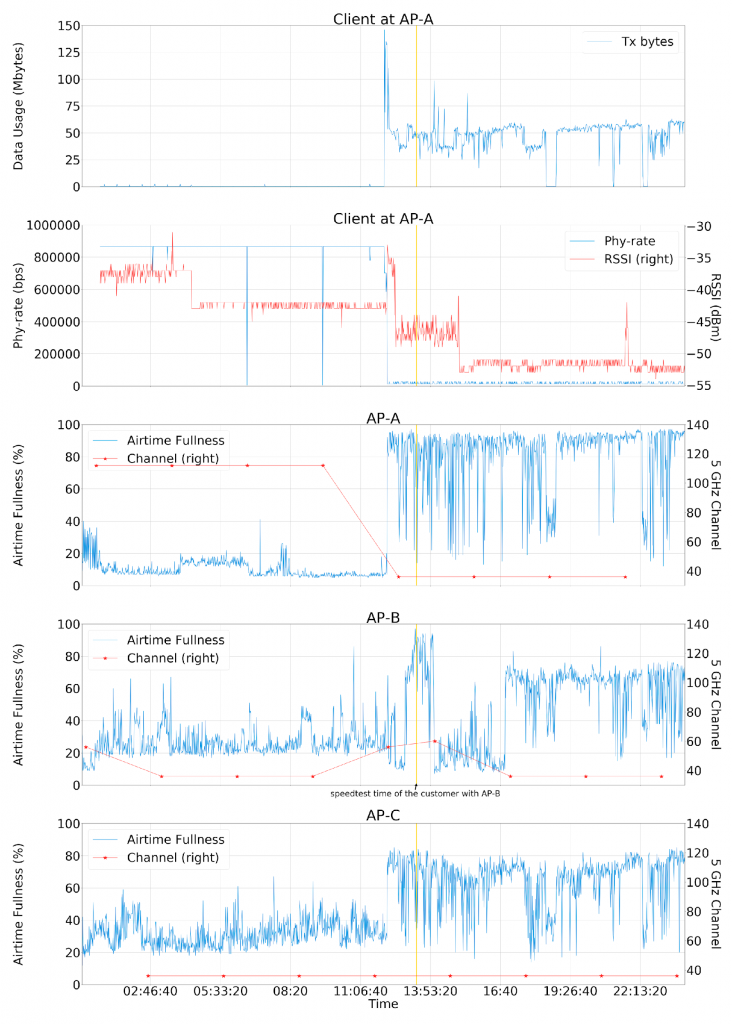
Figure 3. Correlation between data usage of the client at AP-A and airtime fullness of AP-A, AP-B, and AP-C.
At the end of the day…
The key find here is that time-correlation showed a single greedy client is making a whole MDU suffer by bottlenecking the airtime with steady data demand at very low WiFi rates. The ISP was informed about the issue and they reached out to the customer, addressing the negative impact of their Wi-Fi client on the whole neighborhood. Lifemote continues to track the airtime usage in this MDU like it does with many others to detect and solve similar issues – another key point being that any such problem types become part of the ever-growing Lifemote suite of analytics
Advanced analytics for enhanced visibility
Lifemote proactively analyzes all QoE data from all the field population each day. A data driven methodology is utilized to offer advanced insights for the reactive first line problems along with the ability to proactively maintain and fix a broad range of Wi-Fi issues. Poor user experiences are pointed to determine use cases, forming a self-healing network for ISPs.
At the dawn of the IoT era, the number of wireless clients in households is rapidly increasing. Service providers are trying to sustain the growing demands of their customers while scaling their network capabilities simultaneously. The advanced analytics offered by Lifemote can enhance service provider’s visibility on their networks no matter how big they scale their network. Scaling under limited visibility may have catastrophic results as service providers will be overwhelmed by recurring customer complaints. Advanced insights for reactive calls along with proactively reaching out to customers even before they experience any problem will ensure high customer satisfaction with minimal churn risk while keeping extreme loads off call centers.