How frequently 2.4 GHz channel is being used?
The main determinant of band time ratio distribution (i.e. how much time is spent at 2.4 and 5 GHz bands) is the population’s SSID configuration, which can be either SPLIT or SINGLE (see Fig. 1). In SPLIT SSID configuration, the service users will see two SSIDs, one for each band, while trying to choose a Wi-Fi network to connect to. However, in SINGLE SSID configuration, the service users will only have one SSID to connect to and their wireless devices will be automatically steered between two bands by the CPE and clients. Let’s define both configurations’ problems and discuss the solutions.
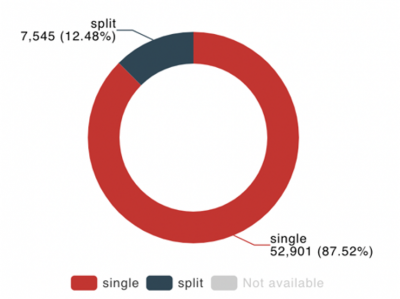
Fig. 1: SSID configuration distribution of an environment.
This is the first post on our blog post series. Check the other posts on the series below:
Problem Definition
In the SPLIT SSID case, the problem is the configuration itself, with the fair assumption that the majority of service users have basic Wi-Fi knowledge. Almost all the time, the 2.4 GHz SSID is set as default and the SSIDs are named poorly such that service users are almost encouraged to use 2.4 GHz SSID for all of their wireless clients. Trusting the service users with connecting their wireless clients to the correct SSID is way too optimistic because the majority of them will not even know the bands’ difference and connect from the default 2.4 GHz anyway.
“If you have SPLIT SSID, do you know how much time
your subscribers are spending at 2.4 GHz band?”
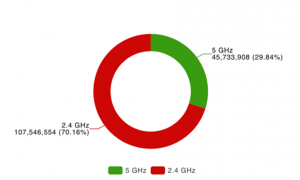
Let’s take a look at a real-life example. Wireless clients in an average environment with SPLIT SSID configuration are, so to speak, wasting the majority of their time (70%) roaming at 2.4 GHz (see Fig. 2.a). This is a perfect example of why ISPs should not burden their subscribers with the role of connecting their capable devices to 5 GHz SSID, because obviously, they cannot.
In the SINGLE SSID case, subscribers are freed from the burden of connecting to the appropriate SSID, because the band-steering is done automatically by the CPE. However, band-steering comes with its own problems. Steering is a reciprocal process, meaning that CPE is not the sole responsible and wireless clients also have a saying in the process. Poorly optimized band-steering thresholds at both sides can cause clients to be stuck at the 2.4 GHz band.
“If you have SINGLE SSID, do you know how much time
your subscribers are spending at 2.4 GHz band?”
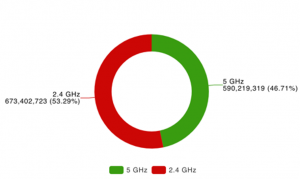
Once again, let’s take a look at a real-life example. The band time ratio is a little better for wireless clients in an average environment with a SINGLE SSID configuration. However, still more than half of the time (53%) is spent roaming 2.4 GHz (see Fig. 2.b).
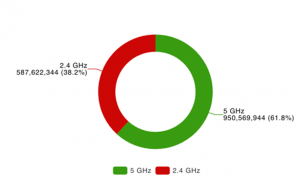
Even in the case of SINGLE SSID with optimized CPE band-steering, there still will be 5 GHz-capable clients connecting from 2.4 GHz since ISPs have no power over band-steering on the clients’ side. Let’s take a look at one last real-life example. Even in the best-performing environment, which also has SINGLE SSID with an optimized CPE band-steering, time spent at 2.4 GHz is as high as 38% (see Fig. 2.c).
(a) (b) (c)
Fig. 2: Band Time Ratio for (a) an average SPLIT SSID environment, (b) an average SINGLE SSID environment, and (c) top performing SINGLE SSID environment
We have defined the problems for both SSID configurations and have an extensive amount of data available. For instance, band time ratio is collected for over 1 million households with 6 million wireless clients, but the real question is; is this data actionable?
Solution
For the SPLIT SSID case, the solution is very simple; DO NOT SPLIT YOUR SSID! As seen in Fig. 2.a, the service users are not very well informed about using the 5 GHz band. The benefits of enabling band-steering by switching to SINGLE SSID configuration are also very well visible in Fig. 2.b. However, if you still insist on using SPLIT SSID configuration, here is what you can do.
- Come up with a better naming for your SSIDs and make the 5 GHz SSID default (i.e. name your 5 GHz SSID as “ISP_Main” and name your 2.4 GHz SSID as “ISP_Legacy”).
- Inform your customers about moving their capable clients to 5 GHz SSID and forgetting the 2.4 GHz SSID on those devices.
For the SINGLE SSID case, the solution simply lies in optimizing the CPE’s band-steering performance. However, the ISPs only have power over CPE vendors, not the client vendors. Fig.2.c indicates that even when the CPE band-steering is optimized, some of the wireless clients are still spending their time at the 2.4 GHz band due to the client’s band-steering. In such cases, the solution lies in creating a dedicated secondary 5 GHz SSID and moving the clients suffering from poor band-steering there while forgetting the main SSID. This solution is not to be applied over the whole subscription base, but rather on the “bad apples”, who have clients stuck at the 2.4 GHz band due to poor band-steering. This is an important feature to request from your vendor while investing in a new device, as it will come in handy for the support center.
It is not rocket science; these solutions are very generic and well-known, but why do we still see so many people suffering from 2.4 GHz over-usage? It is because ISPs have very limited visibility on their deployments, almost blind, so to speak. The solution is there, but the service providers do not know to who to apply this solution. The question is, what is the reason for this blindness?
- There is not enough data to monitor the entire population.
- Even when there is enough data, it does not mean anything unless it is in a sensible format.
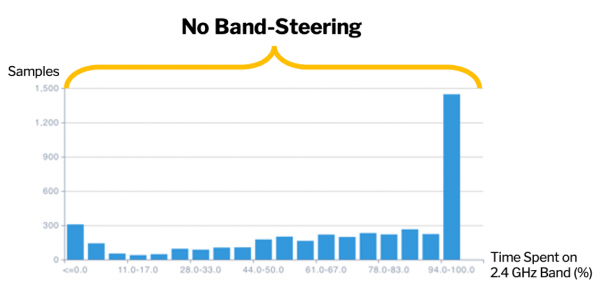
What does it even mean – data in a sensible format? Let’s dive deeper into the band-time ratio distributions of the aforementioned environments. The histograms in Fig. 3 show the distribution of samples in the percentage of time spent on the 2.4 GHz band with a 6% bin size.
- Naturally, the first case with SPLIT SSID configuration has no band-steering at all. This can also be deducted from the histogram (Fig. 3.a); if the majority of samples are accumulated at the right-most bin, that indicates there is no-band steering at all.
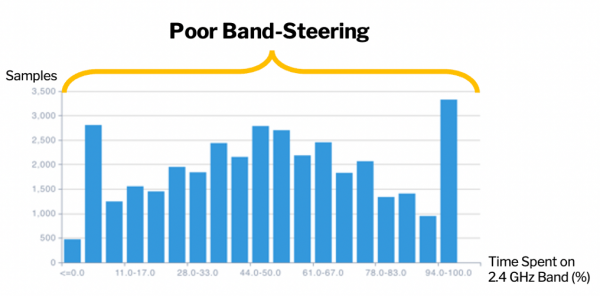
- Regarding the second case, which is the SINGLE SSID in an average environment, the band-steering is fairly poor. The histogram (Fig.3.b) is almost like a uniform distribution, ignoring the local peaks at the upper and lower tails. This indicates that the band steering is performing rather poorly, steering clients to both bands for an almost equal amount of time.
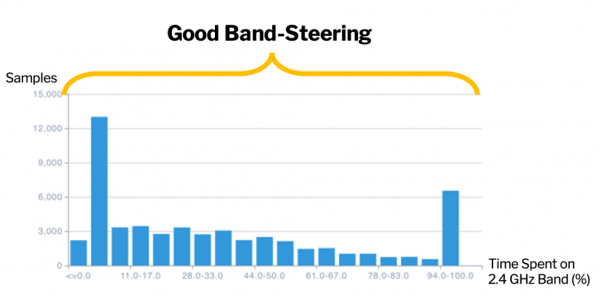
- The third case is the best-performing environment, which is the SINGLE SSID with optimized band steering. The histogram (Fig 3.c) indicates that band-steering is well-optimized since the majority of the samples are accumulated at the second to the leftmost bin.
(a)
(b)
(c)
Fig. 3: Band Time Ratio distribution for (a) an average SINGLE SSID environment, (b) an average SPLIT SSID environment, and (c) top performing SINGLE SSID environment.
“Do you know the distribution of samples in the
percentage of time spent on the 2.4 GHz band for your subscribers?
If you have SINGLE SSID configuration, how well is your band-steering performing?”
Before working on the solutions, one has to know the full depth of the problem. The data alone provided in Fig.2 is never enough. First, the data should be quantified, just like in Fig. 3.b. Even after the transition from Fig.3.a to Fig. 3.b at hand, more structured data with enhanced visibility is required to complete the transition to Fig.3.c. Enhanced visibility is only possible with a data-driven methodology to provide advanced insights on a various range of home Wi-Fi problems. Without a data-driven methodology, you are;
- either unaware of the problem,
- unable to take an action,
- or unable to monitor the effects of any mass-effective decision.
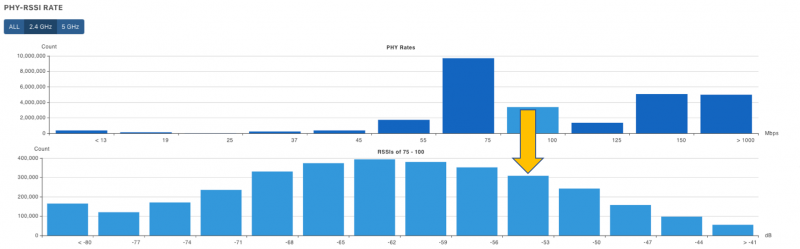
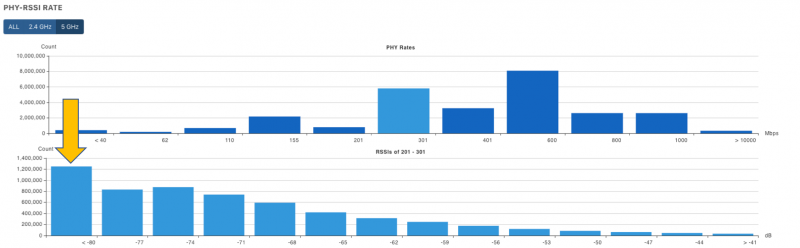
Let’s see how a data-driven methodology was used in an example of how band-steering thresholds are optimized to make the aforementioned transition from Fig. 3.b to Fig.3c. The histograms in Fig. 4 are the distribution of samples for PHY rates of wireless clients with 25 Mbps bin size and distribution of samples for RSSI levels of wireless clients within that PHY rate range with 3 dB bin size.
- In Fig. 4.a, the PHY Rate distribution of 2.4 GHz and the RSSI distribution of samples between 75 and 100 Mbps are observed. In this case, steering from 2.4 GHz to 5 GHz should be made easier, or to be more specific clients with RSSI levels greater than -55 dBm should be steered to the 5 GHz band.
- In Fig. 4.b, the PHY Rate distribution of 5 GHz and the RSSI distribution of samples between 201 and 301 Mbps are observed. In this case, steering from 5 GHz to 2.4 GHz should be made harder, or to be more specific clients with RSSI levels greater than -85 dBm should NOT be steered to the 2.4 GHz band.
(a)
(b)
Fig. 4: PHY Rate and their RSSI distributions for (a) 2.4 and (b) 5 GHz bands.
We successfully made the transition from Fig. 3.a to Fig 3.b by changing the SSID configuration from SPLIT to SINGLE. Later on, we observed that the band-steering was performing poorly, hence an additional touch was made with the help of Fig. 4, completing the transition from Fig. 3.b to Fig. 3.c. Even after all those steps, there is still room for progress. It can be still seen that there are 5 GHz capable clients still roaming the 2.4 GHz band. A final touch here would be creating a 5GHz dedicated secondary SSID and moving the capable clients there.
Would you like to see the actual progress of how the data-driven methodology was utilized to increase 5 GHz usage? Back in the day, the famous “best performing environment with SINGLE SSID configuration” in Fig 2.c was an average environment, whose wireless clients were spending only 45% of their time roaming 5 GHz. The history of how the bulk data was shaped into a masterpiece is displayed in Fig. 5. In a timespan of almost a year, the time spent roaming 5 GHz increased from 45% to 62% and as we mentioned earlier this is not the end-game, there is still room for improvement!
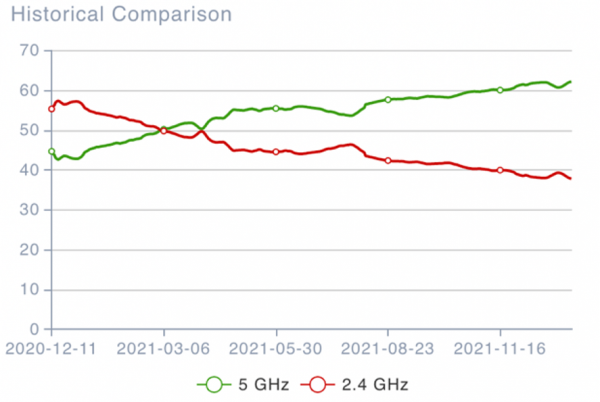
Fig. 5: One-year history of best performing environment’s band time ratio.
Throughout this section, we demonstrated how SINGLE SSID configuration is way more effective than SPLIT SSID configuration, at a population level, with actual field data. However, this does not necessarily mean that SINGLE SSID configuration is plain perfect and does not have problems of its own. As mentioned earlier, band-steering has two folds, CPEs’ band-steering, and clients’ band-steering. It is within ISPs’ options to discuss CPEs’ band-steering parameters with the vendor, but they do not possess any control over clients’ band-steering. Getting stuck at 2.4 GHz is a problem caused by poor band-steering, another one would be over-roaming. Over-roam, as the name suggests, is roaming between the 2.4 and 5 GHz extensively, which eventually results in a degraded quality of experience for the user. A sample over-roaming client can be seen in Fig. 6., in which the client constantly steers between 2.4 and 5 GHz bands in a minute granularity, which inevitably degrades the quality of experience of the user due to massive rate fluctuations.
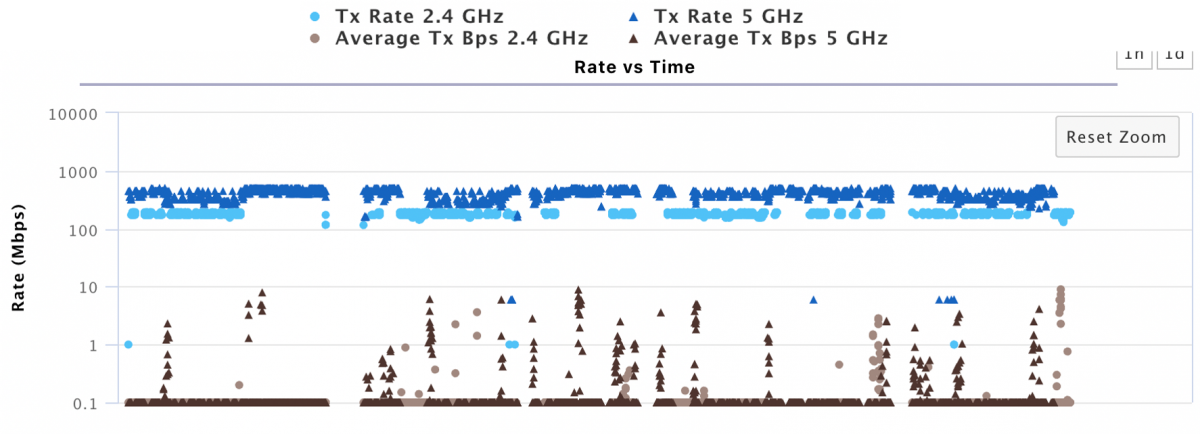
Fig. 6: Rate time series of an over-roaming client.
The solution to the over-roam problem is exactly the same as the solution for clients getting stuck at the 2.4 GHz band after successfully identifying the clients suffering from it, just like in Fig.6. Assuming that the customer has been provided with good Wi-Fi Coverage, a separate 5 GHz SSID should be created, dedicated only to clients who are suffering from bad band-steering due to either the CPE’s or client’s steering parameters. The over-roaming clients should be moved to this SSID and must forget the main SSID to get rid of this problem.
The more traffic, the more congestion

Throughout this paper, we talked about the 2.4 GHz band as if it were a bad thing but were never told why. Metaphorically speaking, the 2.4 GHz band is that old highway in your city that was built years ago. A lot of people need to use it at the same time for the same purpose and when they do, everyone suffers miserably from traffic congestion. The reasons why people are overcrowding this specific highway are;
- Everyone needs to use it at the same time (i.e. going from home to work or vice versa).
- The road was built years ago and was not designed futuristically to support a higher capacity of users. (i.e. not enough lanes with excess width to prevent traffic congestion with more users).
This is exactly the same case with the 2.4 GHz band; if a lot of people use the 2.4 GHz band at the same time, they will become upset due to congestion. As mentioned in the earlier chapters, almost half the time is being spent at 2.4 GHz, meaning that even today people are still using that highway, creating traffic and causing congestion for everyone who uses it. It is easy to identify traffic congestion in real life, but Wi-Fi has a lot of problems that are invisible to the human eye, so how to identify a client suffering from 2.4 GHz channel congestion? The story here is actually in two folds; How full is the airtime and is the client actively using data?
If the airtime is full for 60% or more, the connected clients will be potentially affected by channel congestion. As seen in Fig. 7., the airtime is usually full and the client is actively using data, hence suffering heavily from channel congestion.
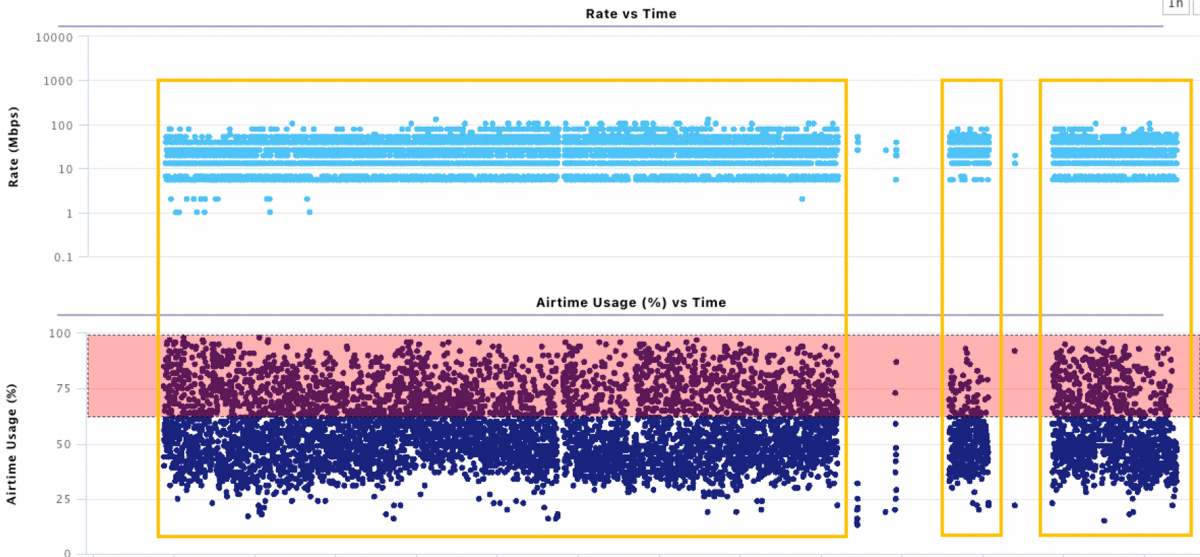
Fig. 7: Rate and Airtime Usage (%) time series of a sample home.
We tried to encourage 5 GHz band utilization, so how and why is the 5 GHz band better than 2.4 GHz in terms of congestion? As seen in Appendix I., in the 2.4 GHz band, the maximum number of channels that do not intersect when used at the same time is three and their bandwidths are limited to 20 MHz. Going back to the metaphor, think of this as a three-lane highway in a cosmopolitan city with lane width barely allowing cars to fit in. The solution to a congested lane is switching to another lane, or in this case, switching to a different channel. However, the problem is not the congestion in the lane, it is the congestion in the highway, meaning that changing the lane is only a temporary solution and you will get congested inevitably. As seen in Figs. 8 and 9, while some ISPs allow their customers to utilize all of the available 2.4 GHz channels, others limit their customers to only use the non-intersecting 2.4 GHz channels.
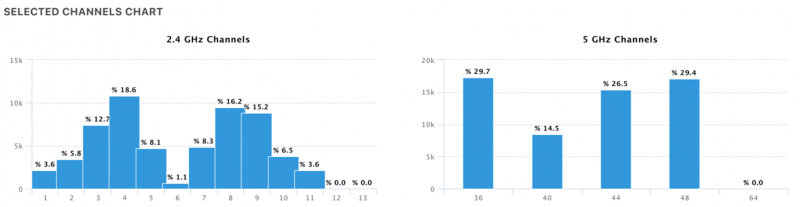
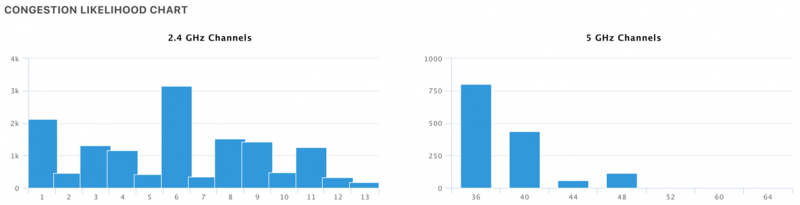
Fig. 8: Distribution of channel utilization in both bands of an ISP.
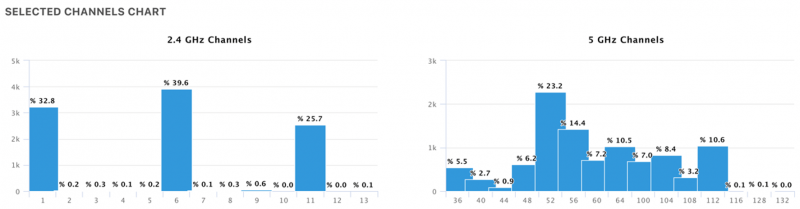
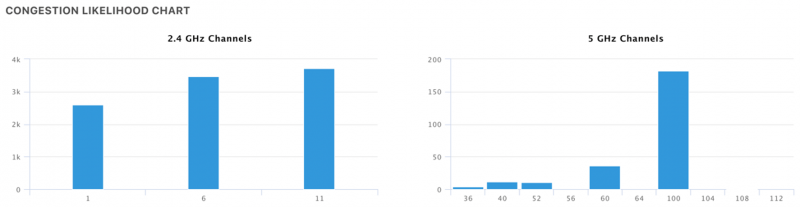
Fig. 9: Distribution of channel utilization in both bands of another ISP.
Even though the second approach, which is utilizing only the non-intersecting channels, prevents interference from other channels, the Figs. 8 and 9 indicate that they are more likely to be congested due to a limited number of alternatives. One can say that trying to solve the congestion problem in the 2.4 GHz band is getting caught between the devil and the deep blue sea, you either get interfered with by utilizing all available channels or you increase the chance of getting congested more often by only utilizing the non-intersecting channels. As mentioned earlier, changing the lane on a congested highway is only a temporary solution, which is clearly depicted in Fig. 10.
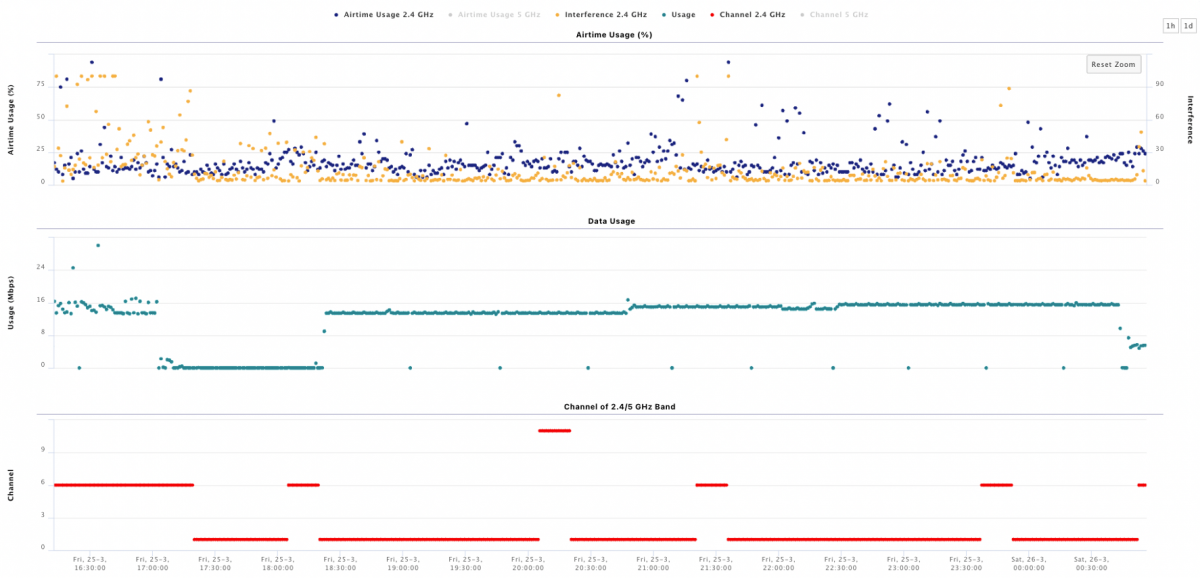
Fig. 10: 2.4 GHz channel selection time series.
The CPE in Fig. 10. is forced to change its 2.4 GHz channel constantly while it is not even the one filling the airtime and since it only has two alternatives besides the channel he is already at, the solution is only temporary and triggers another channel switch event after some time. The ideal solution to both problems would be using the alternative road (rather than switching lanes on the same highway), which has more lanes with increased width. The 5 GHz band has a lot more non-intersecting channels, decreasing the possibility of overcrowding channels with increased bandwidth options, allowing to achieve higher throughput as seen in Appendix II. It can be clearly seen in both Figs. 9 and 10, that congestion likelihood is significantly lower regardless of utilizing all available 5 GHz channels or just the non-intersecting ones.
People get really upset when they are stuck in traffic or try to use the internet in a congested channel, and they tend to blame the authorities, which is the ISP in Wi-Fi world. Even though the solution has been out there for a while, internet subscribers are not very well informed and the ISPs are obliged to spread this awareness. In an ideal world, the 2.4 GHz band should only be utilized by 2.4 GHz-only devices, which are the minority of wireless clients and less likely to suffer from or cause congestion. We must think and act ahead to prevent congestion, all of the suggestions from the previous section should be applied to minimize time spent at the 2.4 GHz band.
The dire need for a data-driven population analytics tool
The world is rapidly evolving, and Wi-Fi is the weak-link falling behind. The average number of in-home clients is going up, the variety and complexity of in-home Wi-Fi problems are increasing and the gap between WAN and in-home speed is drastically getting bigger. The combination of all these is reflected as ISPs as wasted millions of dollars at both CapEx and OpEx, unnecessarily increasing the Total Cost of Ownership. The blindness that is preventing ISPs to save millions of dollars can only be healed with a data-driven methodology relying on daily analysis of the entire population data. This methodology comes with advanced insights for reactive support center complaints along with the ability to proactively maintain and fix a broad range of Wi-Fi issues.
Appendix
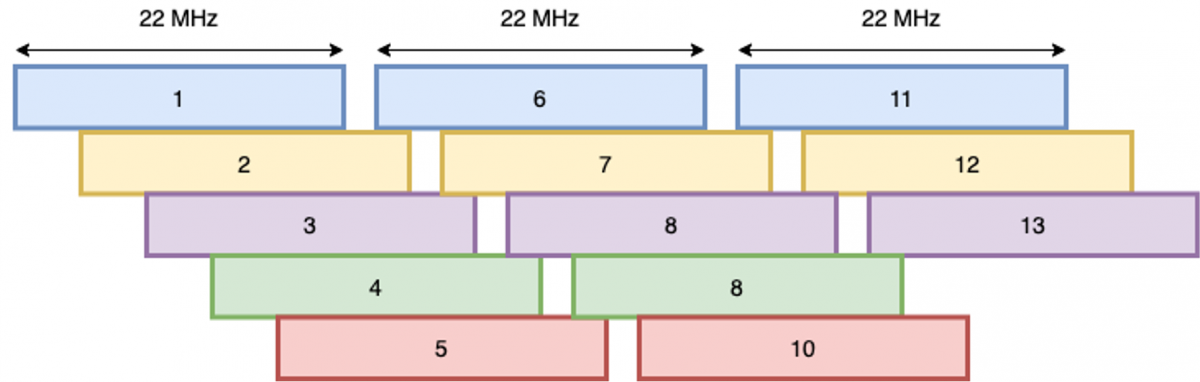
Appendix I: 2.4 GHz channels.
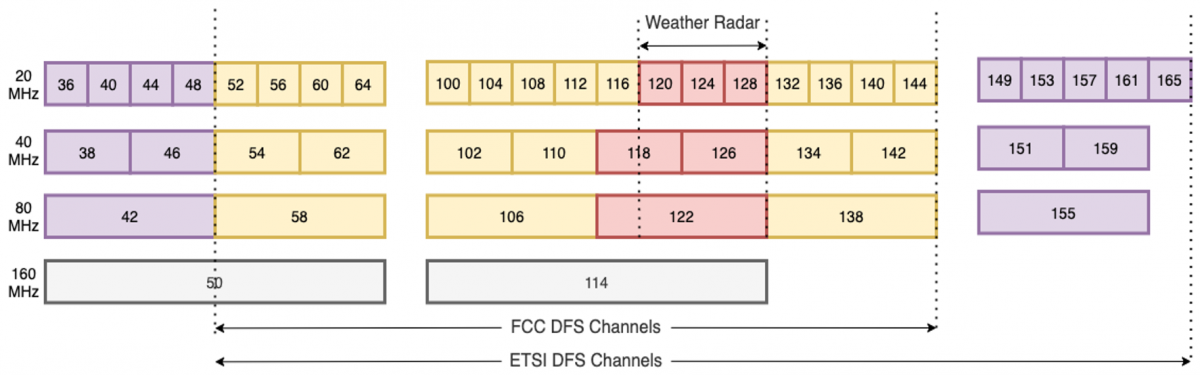
Appendix II: 5 GHz channels.