A Case Study: Increasing customer satisfaction by 67%
Imagine that you are experiencing a problem with your home Internet connection – not fast enough, or not there at all in some rooms. Are you patient enough to call your Internet Service Provider (ISP) to complain? Maybe, if this only happens once. What about the second time? How many times would you initiate this process of long costly calls before you change your ISP?
Now what if your ISP had an idea beforehand about your Quality of Experience?
ISPs all over the world are suffering from mysterious home Wi-Fi issues due to the limited visibility on their networks. The market solution is to offer on-demand analysis to detect and solve customer complaints reactively. But the unsolvable customer complaints are causing a vicious cycle of unhappy customers and high churn rates.
One such Lifemote ISP had been unable to identify the problem behind poor scores in their customer satisfaction surveys. In late 2020, they teamed up with Lifemote to put an end to their customers’ dissatisfaction. Our work together resulted in increasing the survey scores by 67%, while reducing the time end-point customers experienced connection problems by 85%. Here is how Lifemote helped them quantify the most severe issues the population was suffering from and correlated these with customer satisfaction surveys:
The majority of their customers were having good QoE. However, a group of homes were identified as severely suffering either from poor coverage or high congestion according to our analytics. A modem-swap campaign was initiated as the solution. Customers who had the worst experience due to either poor coverage or high congestion were selected as the focus group. Those who agreed to swap their old 2×2 WiFi4 modem with a 3×3 WiFi5 modem were given a short customer survey designed to track the campaign’s success. The customers were asked to rate their satisfaction before and after the swap process in these surveys.

Figure shows the customer survey scores are in line with Lifemote Analytics’ assessment: Homes that are found to have poor WiFi coverage by Lifemote Analytics get poor scores from the customers, while scores rise for homes that are found to be in good coverage (left). Homes that are found to be experiencing congestion by Lifemote Analytics get poor scores from customers, while scores rise up for homes that experience less congestion (right). A week’s worth of data just before the customer filled out the survey in every home is used for both graphs.
The new modem was expected to improve both poor coverage and high congestion due to its extensive coverage range and dual-band support with optimized band steering. Around 3.5K customers agreed to swap-out their modem and filled out the surveys.
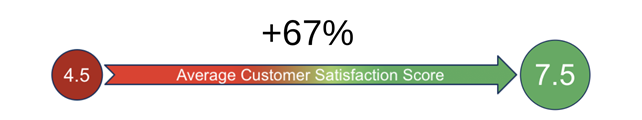
Let’s compare the before and after survey results to understand the campaign’s success from the view of end customers. The average score of customer satisfaction surveys before the modem-swap was 4.5 for the old modem. This score rose up to 7.5 (a 67% increase) after the customers started using their new modem.
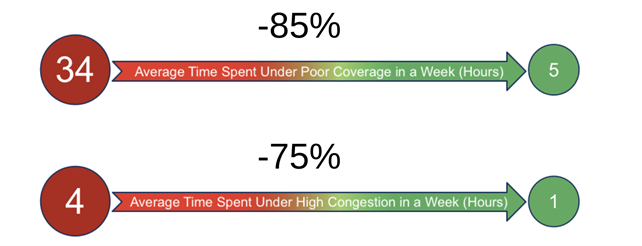
There is more to measuring success than the survey results: Statistics from Lifemote analytics. Customers using the old modem were on average spending 34 hours in poor coverage and 4 hours under high congestion in a week. After switching to the new modem, time spent in poor coverage decreased to 5 hours (by 85%) and time spent under high congestion decreased to 1 hour (by 75%).

Figure shows the time spent under high congestion (left) and time spent under poor coverage (right) in minutes decrease when the old 2×2 WiFi 4 modems are swapped with the new 3×3 WiFi 5 modems. One week’s worth of data before the swap for the old modems are compared to data after the swap for the new modems in every home. Both graphs are histograms, showing how frequently a time duration spent under high congestion or poor coverage occurs in a week. The frequencies of longer time under high congestion and poor coverage decrease, while the frequencies of smaller time under high congestion and poor coverage decrease -the increases around 0 speak for themselves.
With our data driven approach, we help fix a wide range of home Wi-Fi issues. The solutions lie not only in the advanced insights we provide for the reactive first line problems but also in the ability to proactively step in. Solving customer problems even before they realize they have some is the key to happy customers’ land where minimal churn rates live.